BE - Strategy Builder ToolkitIndicator vs Toolkit:
This is definitely not an indicator, hence this doesn't do any kind of analysis nor provide meaningful outputs where you can take trading decisions out of it.
This is a Strategy Builder Toolkit which works like any other broker/3P applications, which helps traders to build their own custom/ predefined strategies, save / deploy them at their wish.
Idea Behind Developing this Toolkit: I am sure many of traders have overcome scenarios where, on break of x level he wants to initiate straddle else he wants to initiate Iron Condor. Some of them wants to deploy custom strategies only at certain time or at certian price levels.
It becomes pretty difficult to track markets when you are away from desk and if you dont adjust the strategy legs, you are incurring big drawdowns. There are many if's and buts to deploy strategies.
To overcome such challenges, i have built this toolkit.
Note: As this is just a toolkit, you should conduct your analysis to gauge the market direction outside the perview of this. Once you know the view / direction of the script. you can use this toolkit in action to
1. Deploy Strategy at (Desired levels| Desired time|Confired Levels|Confirmed Volumes)
2. Strategy can be Prebuilt / Custom Built
3.1 Set SL, Target for Directional view (Trail SL aswell)
3.2 Set Upside or Downside Target for Non Directional view (Trail SL aswell)
3.3 let the strategy play with out SL|Targets for consolidation view.
4. Adjust Legs by closing existing position and opening fresh position or place fresh adjustments
5. Book partial Profits with in the zone.
How the Toolkit is buit: Script uses text related functions to understand the custom input given in the indicator and coverts into a strategy and deployes them as a algo trading (Next Level Bot) with the additional parameter set for SL|Target|Entry levels.
Understanding the settings:
1. Strike Difference: is basically a value between each strike. eg: Banknifty : 100, Nifty & Finnifty: 50
2. 1 Lot Qty: Qty per Lot accepted by exchange|Broker. eg: BNF: 15, Nifty: 50, Finnifty: 40
3. Lot Multiplier: If you build strategy with 1 lot and if you set the Lot multiplier as 2 then strategy gets deployed with 2 lots. for eg. If i have saved strategy to buy BNF 1 ITM with 1Lot and have set lot multipier to 3 then at the time of deploying the trade it pushes as 3 lots (3 * 15Qty per lot = 45Qty) of 1 ITM strike.
4. Symbol Name: Select the Symbol Name here.
5. Current & Next Week Expiry Date: Specify the expiry Dates in the format as supported by your broker.
6. Broker Name, Exchange & Product Type: hope it is self explanatory.
IMPORTANT settings to understand:
7. Triggere Entry Post (optional): You have to specify when you want to deploy the strategy. For instance, if i want to deploy my strategy at 30 min after market open which is 9:45 am, then i have specify as 0945. Another instance where i want to close my strategy at 3 PM then you have to specify as 1500. Uncheck this option if you are not worried about the time of entry.
My personal Used Case: On the Expiry -1 Day at 0916 (9:16AM) i will buy 6 lots of 8OTM PE & CE and Sell 2 lots 7OTM, 2 lots of 6OTM and 2 lots of 5OTM and close the trade by 1100 (11AM).
8. Price Levels (Confirmed vs UnConfirmed) (Optional): Confirmed is basically price is sustained at|around the specified price level, where in UnConfirmed is basically the touch of the specified level.
for instance if i want to deploy straddle only if price is sustained at 100. then, i would specify GE with 100 in price input settings, and check thee Confirmed price box. Assuming if LTP is running at 98 and with the above settings it will only deploy the trade upon price is sustained at 100 level for 3 to 5 candles not at the touch of 100.
Uncheck this option if you are not worried about the Entry Price.
9. Confirmed Volume (Optional) (Long or Short): Basis your view|direction of the strategy. you can get additional confirmation. At the time of entry you want volume to be present towards the direction of the strategy. Uncheck this option if you are not worried about the volume or Volume doesn't exist for the chart loaded.
10. Alert Types: It consists of 3 Long & 3 Short directional (prebuilt) strategy along with Close Strategy, Close Specified Symbols Only & Design Custom Strategy Option.
10.1 : Slow Upmove - If you are having bullish view and predict that prices shall go slow and steady. This strategy can be deployed where you get the benifit of time decay as well while the delta play in favor of you. (viseversa for Slow DownMove)
10.2 : Fast Upmove - If you are having bullish view and predict that prices shall go fast. This strategy can be deployed where you get the smaller benifit of time decay as well while the delta play in favor of you. (viseversa for Fast DownMove)
10.3 : Vol Upmove (Volatality)- If you are having bullish view and predict market is tend to be volatile. This strategy can be deployed where you get the benifit of volatility as well while the delta play in favor of you. (viseversa for VolDownMove)
10.4 : Close Trade - You can use this option close the deployed strategy completely.
10.5 : Close Symbols - You can use this option close few of the symbols for the strategy deployed.
10.6 : Custom: Use this option to design you own custom strayegy with the syntax below:
Sample 1:
N|B|C2|3
N refers to Nextweek Expiry (if C is used then Current week expiry)
B refers to Buy (if S is used then Sell)
C refers to Call | CE (if P is used then PE or Put)
2 refers to 2OTM (for CE any Postitive number refers to as OTM and for PE it will be treated as ITM strikes & 0 refers to as ATM - viseversa for Negative Numbers)
3 refers to as 3 Lot
With the syntax of N|B|C2|3 - strategy will be deployed as "Buy 3 lots of 2 OTM Call of Next expiry"
Sample 2:
C|S|P-3|3|10|30
Above syntax means: SELL Current Expiry 3 Lots of 3 OTM Put Strike with 10 SL and 30 TGT
Sample 3:
C|S|C10|3|Default
Above syntax means: SELL Current Expiry 3 Lots of 10 OTM CALL Strike with 50% SL and 95% TGT
Sample 4:
C|B|C-2|3|40%|50%
Above syntax means: BUY Current Expiry 3 Lots of 2 ITM CALL Strike with 40% SL and 50% TGT
Sample 5: Long Straddle
C|B|C0|3
C|B|P0|3
Above syntax means: BUY Current Expiry 3 Lots of ATM CALL & PUT Strike
Sample 6: Iron Butterfly
C|B|C1|1
C|S|C0|1
C|S|P0|1
C|B|P-1|1
Above syntax means: Sell Current Expiry 1 Lots of ATM CALL & PUT Strike and BUY 1OTM Call & Put Strike
Sample 7: Diagonal Spread
C|S|C2|1
C|S|P-2|1
N|B|C3|1
N|B|P-3|1
Above syntax means: Sell Current Expiry 1 Lots of 2OTM CALL & PUT Strike and BUY 3OTM Call & Put Strike of Next Expiry.
To Understand how to deploy Strategy with defined Adjustments. For instance i want to deploy Iron Condor with Adjustments for BNF when the price is currently running at 45000.
C|B-|C3|1
C|S*|C2|1
C|B--|P-3|1
C|S**|P-2|1
At:2|C|S|C2|1
At:2|C|B|C3|1
At:-2|C|S|P-2|1
At:-2|C|B|P-3|1
On:2|*
On:-2|**
On:2|-
On:-2|--
With the above syntax: Intial trades are placed with
BUY BANKNIFTY45300CALL(Current Expiry) 1 Lot
BUY BANKNIFTY44700PUT(Current Expiry) 1 Lot
SELL BANKNIFTY45200CALL(Current Expiry) 1 Lot
SELL BANKNIFTY44800PUT(Current Expiry) 1 Lot
Toolkit tracks the price and holds the adjustments.
We may start to bleed on the sold leg (45200CALL) once the price crosses 45200. Hence if the price crosses 2 strike upside as specified with syntax " On:2|* " where * is a character tagged to Sold Call Leg. it closes the 45200 Call.
Similarly, " On:2|- " where - is character tagged to Brought Call Leg. it closes the 45300 Call, as soon as prices reaches 2 strike upside.
At:2|C|S|C2|1
At:2|C|B|C3|1
With the At Statements you can place the fresh adjustments legs. Above syntax refers to Once the price reaches 45200 it places below adjustment legs.
BUY BANKNIFTY45500CALL(Current Expiry) 1 Lot
SELL BANKNIFTY45400CALL(Current Expiry) 1 Lot
Note: Similarly If prices reaches downside with the On and At Sytax it places the necessary adjustment legs accordingly.
11. SL & TGT - You can specify SL, TGT or Upside & Dowside TGT during the entry conditions and Stratey shall be closed upon hitting either the SL or TGT accordingly.
12. On % Tgt & Lock % SL: This option is used for Prebuilt strategy where you can lock the Profit | Set Revised SL upon hitting specified TGT percentage.
13. Close Symbols: This option is used if you select Alert type as Close Symbols (Ref - 10.5 : Close Symbols) for specified list of symbols Alert shall be pushed to close the open positions of those symbols.
DISCLAIMER: No sharing, copying, reselling, modifying, or any other forms of use are authorized for our documents, script / strategy, and the information published with them. This informational planning script / strategy is strictly for individual use and educational purposes only. This is not financial or investment advice. Investments are always made at your own risk and are based on your personal judgement. I am not responsible for any losses you may incur. Please invest wisely.
Happy to receive suggestions and feedback in order to improve the performance of the indicator better.
ابحث في النصوص البرمجية عن "the strat"

Strategy Developer ToolSolar Strategies: Strategy Developer Tool Complete Guide
This guide provides full explanation of the intended purpose of our script along with individual explanation of each input and the logic behind them coupled with general knowledge which we find useful in using our tool regarding elements of risk and strategy. Use this information wisely and understand we are not providing financial advise, this is a learning tool meant to help advance traders knowledge of the markets and their strategies which are formed as such.
Basics
Before getting into the specifics of how to use our strategy developer tool, it's important to understand a few basic fundamental things about it. The purpose of the tool is to allow the user to optimize a strategy through back testing with our strategy tracker and 50+ user inputs. The way you optimize your strategy depends on a couple things:
The state of the current and recent previous market.
The timeframe you trade on.
The types of trades you prefer. (swings, scalps, etc.)
How much risk you are willing to take on.
Risk Basics:
Going off the last bullet point on the list above, risk plays a huge part in how you optimize your strategy, with that being said here are a few general rules of risk as they relate to trades:
The more trades you take on, the more risk you are opening your strategy up to.
If done correctly, more trades will often result in more profit with slightly lower accuracy, and more risk.
The less trades you take on, the easier it is to have higher accuracy because ideally by rooting out the losing trades, you are left with fewer overall trades but mostly winning trades.
Less trades with higher accuracy often result in less profit but will 100% be less risky than the opposite. (More trades, less accurate, more profit, MORE RISK)
Input Basics:
More trades, less trades, more risk, less risk, what does this all mean as it relates to our tool?
The 50+ user inputs that allow you to optimize and create your strategy all effect when the script takes a trade.
Many of the inputs are essentially conditions. By changing these inputs, what you are doing is changing how specific the conditions need to be in order to take a trade.
This is how the inputs tie into the bullet point list above regarding risk and the number of trades you take on. By raising or lowering certain inputs, you are making the conditions more or less specific on when to trade.
Making conditions more specific will allow for less trades to be taken and will often result in a higher win rate, and less associated risk.
Making conditions less specific will allow for more trades to be taken and depending on the state of the market, could result in more profit being realized, but at the same time opens you up to more risk because you are stating a more general set of conditions in order to take a trade.
How does it work?
Our strategy developer tool is based on two simple factors in order to identify specific areas in the market deemed good for trade. They are as follows:
Directional momentum to identify when a move might happen.
A confirmation of the desired move.
Indicators:
The tool gets its information on these two factors from two custom built indicators which are hard coded into the script. These two indicators and the inputs which affect them can be found labeled with Indicator 1 or Indicator 2 in the tool's settings.
When the conditions are met based on the factors of both indicators, it then decides your stop losses and take profits using pivot points.
Indicator 1 is the momentum indicator.
Indicator 2 looks for confirmation of the move.
Hedges:
Since nothing is ever certain when trading, our tool also aims to minimize potential loss before it can happen by incorporating hedges when a signal prints in the opposite direction of the trade you are currently in.
To identify when to hedge, the candles will appear with the opposite color of your original trade. Candles, while in a long trade, appear as green and candles while in a short trade appear as red. While in a long trade the only time red candles will appear is when a hedge occurs and vice versa for shorts.
Example: If you just took a long trade based on a long signal that the script gave off, but a short signal prints off while you are in the long, you are directed to sell half your long position and enter that half into a short position. Since there is now more uncertainty in the long because of the short signal, minimizing your position size and having a smaller position in the opposite direction allows you to cover your bases if the trade moves against you. If it doesn’t move against you and ends up going long as originally intended, you are not to lose any money, likely a small profit or break even when all is said and done.
In order to give the hedges a greater change of hitting, the take profits are smaller than a normal trade, this way even if your hedge wasn’t necessary and the original trade does not move against you, it's likely that your hedge will still win, and you can just consider it a small scalp to further your profits on the original trade.
Doubles:
Besides minimizing loss, we also aim to maximize the potential gain. When a second signal prints off in the direction of the trade you are currently already in, the tool directs you to double your position size.
The signal for doubling is a label with “2x” written inside.
The logic here is similar to hedging but in the opposite way. Just as a signal in the opposite direction creates uncertainty, a signal in the same direction indicates more certainty hence doubling your position size.
Example: If you are currently in a long position and you get a second long signal, you would then double your existing position since two long signals printing off before the first one has a chance to play out indicates a stronger chance of movement in the intended direction of your trade.
User Inputs
Upon opening the tools settings tab, you will find all the user inputs which can then be modified to fit your desired strategy. In this section of our guides, you will find individual explanations and use cases for each input so you can correctly use them to your best advantage.
Strategy Tracker Table:
By ticking this input on, the strategy tracker table will be visible to the user. (Default is on)
Indicator 1 Greater Than: Long:
By ticking this input on, you are adding a condition the script will then look for in order to take a long. (Default is on)
This condition is that an average of indicator 1, which searches for momentum, must fall above a certain level, which is determined in the next input.
The purpose of this is to ensure that the average momentum is not too low because this would indicate prolonged downwards movement on the timeframe of the market being observed, making a long position riskier.
Indicator 1 Greater Than Input: Long:
This input correlates to the previous input directly above.
If Indicator 1 Greater Than: Long is ticked on, then one of the conditions in order to take a long position will be that the average of indicator 1 must fall above the level which you set in this input.
max level 100, min level 0
Indicator 1 Less Than: Long
By ticking this input on, you are adding a condition the script will then look for in order to take a long position. (Default is on)
This condition is that an average of indicator 1, which searches for momentum, must fall below a certain level, which is determined in the next input.
The purpose of this is to ensure that the average momentum is not too high, because this would indicate a prior significant upwards movement or trend on the timeframe of the market being observed.
Taking a long position while the average momentum is at higher levels exposes the risk of longing as the market has started to pull back from a peak or when the market has just reached a peak.
Indicator 1 Less Than Input: Long
This input correlates to the previous input directly above.
If Indicator 1 Less Than: Long is ticked on, then one of the conditions in order to take a long position will be that the average of indicator 1 must fall below the level which you set in this input.
max level 100, min level 0
Indicator 1 Greater Than: Short
By ticking this input on, you are adding a condition the script will then look for in order to take a short. (Default is on)
This condition is that an average of indicator 1, which searches for momentum, must fall above a certain level, which is determined in the next input.
The purpose of this is to ensure that the average momentum is not too low because this would indicate prolonged downwards movement or trend on the timeframe of the market being observed.
Taking a short position while the average momentum is at lower levels exposes the risk of shorting as the market has started to recover from a bottom or when the market has just reached a bottom.
Indicator 1 Greater Than Input: Short
This input correlates to the previous input directly above.
If Indicator 1 Greater Than: Short is ticked on, then one of the conditions in order to take a short position will be that the average of indicator 1 must fall above the level which you set in this input.
max level 100, min level 0
Indicator 1 Less Than: Short
By ticking this input on, you are adding a condition the script will then look for in order to take a short position. (Default is on)
This condition is that an average of indicator 1, which searches for momentum, must fall below a certain level, which is determined in the next input.
The purpose of this is to ensure that the average momentum is not too high, because this would indicate a prior significant upwards movement or trend on the timeframe of the market being observed.
Taking a short position while the average momentum is at higher levels exposes the risk of shorting as the market is currently in a strong uptrend.
Indicator 1 Less Than: Short
This input correlates to the previous input directly above.
If Indicator 1 Less Than: Short is ticked on, then one of the conditions in order to take a short position will be that the average of indicator 1 must fall below the level which you set in this input.
max level 100, min level 0
Summary of Input Group: Indicator 1 Greater/Less Than Long/Short
This grouping of inputs is best used as a filter of sorts, much like many of the other inputs which are also essentially filters of the market to find areas ripe for trade. Specifically, however, this group of inputs is especially powerful because if used correctly, it can specify a range for the average momentum to fall in when looking for either long or short trades. Think of it like a sweet spot where the average is not too high nor too low. In combination with the numerous other inputs which will shortly be explained, this sweet spot can be a great indication. Keep in mind that once you find a working range, this will not last forever. Conditions in the market are ever changing and as such your inputs, in this case the range the average momentum must fall in, will also need to change with the market conditions.
Bars Since Crossover:
This input simply describes a crossover of the momentum indicator (indicator 1) and its average.
In the category How does it work? Two main factors are discussed, the first being directional momentum to determine when an upwards move might happen. The crossover correlated to this input is the directional momentum as mentioned earlier.
As also mentioned in How does it work? The second factor is a confirmation of the desired upwards move. This confirmation is a crossover of the current price and indicator 2 which will be further addressed later on.
What's important to understand about the two key factors at play in regard to Bars Since Crossover is that this input is determining a condition which looks for a certain number of bars prior to the confirmation of indicator 2 which the crossover of momentum and its average has happened on indicator 1.
Example: Bars Since Crossover input is set to 10. This means that the crossover of momentum and its average from indicator 1 must be within 10 bars prior to the confirmation from indicator 2. If this happens then this condition is met for a long position.
Bars Since Crossunder:
This input simply describes a crossunder of the momentum indicator (indicator 1) and its average.
In the category How does it work? Two main factors are discussed, the first being directional momentum to determine when a downwards move might happen. The crossunder correlated to this input is the directional momentum as mentioned earlier.
As also mentioned in How does it work? The second factor is a confirmation of the desired downwards move. This confirmation is a crossunder of the current price and indicator 2 which will be further addressed later on.
What's important to understand about the two key factors at play in regard to Bars Since Crossunder is that this input is determining a condition which looks for a certain number of bars prior to the confirmation of indicator 2 which the crossunder of momentum and its average has happened on indicator 1.
Example: Bars Since Crossunder input is set to 10. This means that the crossunder of momentum and its average from indicator 1 must be within 10 bars prior to the confirmation from indicator 2. If this happens then this condition is met for a short position.
Summary of Input Group: Bars Since Crossover/Crossunder
These two inputs can have a large effect on the types of trades being taken and the risk which your strategy opens up to. The idea is that in order for the two key factors described in How does it work? to be correlated and therefore indicate a strong directional move, the two events must happen within a somewhat small period of time. If the period of time between the two events taking place is too large, then it's riskier for your strategy due to a delay in directional momentum and the necessary confirmation. It's important to note that this “small period of time” is relative to the security you're trading and the timeframe its being trades on. Small could mean 5 bars in some cases or 20 bars in others, this is why our custom back tester exists. So that the process of optimization on different securities and different timeframes is smooth and only requires adjustments to inputs then your own analysis of the back test results.
Indicator 1 Input Long
Defines how strong the upwards momentum needs to be in order to take a long position.
When optimizing your strategy, this input is likely to have some of the most effect on when the script takes a long position.
The reasoning for this is because the level you set for this input is the level which indicator 1 must close above following the crossover of its average.
Example: Indicator 1 Input Long set to 50, this means that when the momentum crosses over its average from indicator 1, upon the close of this crossover the momentum must be above the level 50 in order for this condition to be met to take a long position.
The higher the level, the stronger the upwards momentum must be, and therefore by using higher levels for this input, the script will search for stronger directional moves leaving less chance for the trade to move against you.
Indicator 1 Input Short
Defines how strong the downwards momentum needs to be in order to take a short position.
When optimizing your strategy, this input is likely to have some of the most effect on when the script takes a short position.
The reasoning for this is because the level you set for this input is the level which indicator 1 must close below following the crossunder of its average.
Example: Indicator 1 Input Short set to 40, this means that when the momentum crosses under its average from indicator 1, upon the close of this crossunder the momentum must be below the level 40 in order for this condition to be met to take a short position.
The lower the level, the stronger the downwards momentum must be, and therefore by using lower levels for this input, the script will search for stronger directional moves leaving less chance for the trade to move against you.
Summary of Input Group: Indicator 1 Input Long/Short
These two inputs are so important to your strategy because at the end of the day no matter how you set it up, it's still a momentum-based strategy. With that being said the level of momentum or the strength needed in order to take trades is of course going to be a key decider in the successfulness of the strategy. When optimizing these two inputs make sure to take into account what the overall market conditions are, meaning if it’s a bull market maybe make the momentum needed to take a long slightly less comparatively to the amount needed to take a short, in other words make long conditions less specific and short conditions more specific. Slight variations of this input can have very big effects, even changing it by 1 or 2 can make a major difference. In might even be good to consider starting optimization with these inputs and then work the rest of the strategy out from there. A lot could be said about these inputs and more docs will be added in order to further explain more strategy approaches revolving around them, for now don’t hesitate to ask any questions.
Indicator 2 Red
This input is used as a sort of chop filter at its base level, however if used correctly it can be a much broader filter for what areas of the market you want to trade in.
Indicator 2 shows as either red or green and is used as a confirmation when price crosses over it following the crossover of momentum and its average from indicator 1 to take a long position.
If ticked on, Indicator 2 Red states a condition in order for the script to take a long position. (Default is on)
The condition is that upon the crossover of the current price and Indicator 2, 10 bars ago indicator 2 must have been red.
The reason for this input is because the current color of indicator 2 upon the crossover must also be red. However, this condition is hard coded in and cannot be changed by any input.
This is because the type of trade being targeted is that of a type of reversal or continuation.
If indicator 2 showed green 10 bars ago and is currently red this would indicate that a top was just reached, and price is reversing downwards making this not a good area to take a long.
Another scenario if indicator 2 showed green 10 bars ago and is currently red is that there is currently a sideways trend going on or otherwise known as chop, also not an ideal area to take a long
However, if 10 bars ago indicator 2 was red and it's currently red this would indicate a more prolonged pullback.
If all conditions are met and we know that price has been pulling back, now we can enter a long with more knowledge pointing to price reversing upwards from a downwards trend, or continuing its upwards trend after a pullback.
Indicator 2 Green
This input is used as a sort of chop filter at its base level, however if used correctly it can be a much broader filter for what areas of the market you want to trade in.
Indicator 2 shows as either red or green and is used as a confirmation when price crosses under it following the crossunder of momentum and its average from indicator 1 to take a short position.
If ticked on, Indicator 2 Green states a condition in order for the script to take a short position. (Default is on)
The condition is that upon the crossunder of the current price and Indicator 2, 10 bars ago indicator 2 must have been green.
The reason for this input is because the current color of indicator 2 upon the crossunder must also be green. However, this condition is hard coded in and cannot be changed by any input.
This is because the type of trade being targeted is that of a type of reversal or continuation.
If indicator 2 showed red 10 bars ago and is currently green this would indicate that a bottom was just reached, and price is reversing upwards making this not a good area to take a short.
Another scenario if indicator 2 showed red 10 bars ago and is currently green is that there is currently a sideways trend going on or otherwise known as chop, also not an ideal area to take a short.
However, if 10 bars ago indicator 2 was green and it's currently green this would indicate a more prolonged upwards movement.
If all conditions are met and we know that price has been moving up, now we can enter a short with more knowledge pointing to price reversing downwards from an upwards trend, or continuing its downwards trend after a bounce up.
Summary of Input Group: Indicator 2 Red/Green
Similar to Indicator 1 Greater/Less Than Long/Short, the goal of these inputs is to try to get a picture of what the previous recent market has been doing. By getting this picture it's easier to find different areas of the market more ideal for trades. Different from Indicator 1 Greater/Less Than Long/Short though, Indicator 2 Red/Green is directly correlated to the price action in the market rather than the momentum. By switching these on or off you are setting more or less specific conditions for taking trades. Some markets require this extra condition to lower your risk in your strategy, however others may not.
Pivot Low
This input is used to define the number of bars the script will look back to grab a pivot low when taking a long position.
This pivot low is then used to set the stop loss when entering a long position.
This input is very important and optimizing it correctly can be extremely crucial to your strategies success.
The Strategy Developer tool uses a 1:1 risk to reward ratio when setting your first take profit point, so when the script looks back to get a pivot low based on the input you set, it will then set your first take profit at an equal ratio to the stop loss found from the pivot low.
The goal in optimizing this input is to give enough lookback to find real pivot points where price has reversed off of, but not to give too much lookback where its grabbing previous pivot points unrelated to the current move of momentum the script is giving a long signal from.
Consider the type of trades you're looking for in your strategy and what timeframe you are trying to trade on.
Longer swing trades which aim to catch bigger moves in the market, possibly on higher time frames, may require a further lookback in order to get your take profits in the correct positioning to catch the desired move, and not exit early before the trade has fully played out.
Shorter scalp trades may aim to catch smaller moves and therefore you don’t want to allow for too much risk by having a large stop loss and large take profits as a result.
Pivot Low 2
Pivot low 2 can be thought of as a backup lookback in order to get the correct pivot low.
In an input which will be discussed shortly called Pivot Low Minimum, you can set a minimum percentage for your pivot low to be, if the pivot low does not meet the minimum then the script will look to Pivot Low 2’s input to use as a bar lookback in order to get the correct pivot low.
This input is used because you might find a Pivot Low input that works well for the majority of the trades in your back tested strategy, however, there will always be outliers and when this Pivot Low input falls short of getting the correct level to put your stop losses at, Pivot Low 2 is used.
Pivot Low 2’s input should always be higher than Pivot Low’s input, that way you can allow the script to look back further in time to find the correct level when the minimum is not met.
Pivot High
This input is used to define the number of bars the script will look back to grab a pivot high when taking a short position.
This pivot high is then used to set the stop loss when entering a short position.
This input is very important and optimizing it correctly can be extremely crucial to your strategies success.
The Strategy Developer tool uses a 1:1 risk to reward ratio when setting your first take profit point, so when the script looks back to get a pivot high based on the input you set, it will then set your first take profit at an equal ratio to the stop loss found from the pivot high.
The goal in optimizing this input is to give enough lookback to find real pivot points where price has reversed off of, but not to give too much lookback where its grabbing previous pivot points unrelated to the current move of momentum the script is giving a short signal from.
Consider the type of trades you're looking for in your strategy and what timeframe you are trying to trade on.
Longer swing trades which aim to catch bigger moves in the market, possibly on higher time frames, may require a further lookback in order to get your take profits in the correct positioning to catch the desired move, and not exit early before the trade has fully played out.
Shorter scalp trades may aim to catch smaller moves and therefore you don’t want to allow for too much risk by having a large stop loss and large take profits as a result.
Pivot High 2
Pivot high 2 can be thought of as a backup lookback in order to get the correct pivot high.
In an input which will be discussed shortly called Pivot High Minimum, you can set a minimum percentage for your pivot high to be, if the pivot high does not meet the minimum then the script will look to Pivot High 2’s input to use as a bar lookback in order to get the correct pivot high.
This input is used because you might find a Pivot High input that works well for the majority of the trades in your back tested strategy, however, there will always be outliers and when this Pivot High input falls short of getting the correct level to put your stop losses at, Pivot High 2 is used.
Pivot High 2’s input should always be higher than Pivot High’s input, that way you can allow the script to look back further in time to find the correct level when the minimum is not met.
Pivot Low Risk Tolerance
This input is very important in managing the risk associated with your strategy.
Pivot Low Risk Tolerance is defining a maximum percentage the pivot low can be away from your entry.
Since the pivot low that’s found is assigned to your stop loss and directly affects the placement of your take profits when taking a long position, making sure the pivot low isn’t too far down is crucial.
Depending on the types of trades you're aiming to take, the timeframe you choose to trade on, and the leverage you use in your strategy, you may want to assign a higher risk tolerance or a lower one.
Example: Pivot Low Risk Tolerance input set to 3, this means that when all other conditions are met in order to take a long position, when searching for the pivot low in order to set a stop loss, if the script finds the pivot low is greater than 3% away from the entry point, it will not take the trade.
Pivot High Risk Tolerance
This input is very important in managing the risk associated with your strategy.
Pivot High Risk Tolerance is defining a maximum percentage the pivot high can be away from your entry.
Since the pivot high that’s found is assigned to your stop loss and directly affects the placement of your take profits when taking a short position, making sure the pivot high isn’t too far up is crucial.
Depending on the types of trades you're aiming to take, the timeframe you choose to trade on, and the leverage you use in your strategy, you may want to assign a higher risk tolerance or a lower one.
Example: Pivot High Risk Tolerance input set to 3, this means that when all other conditions are met in order to take a short position, when searching for the pivot high in order to set a stop loss, if the script finds the pivot high is greater than 3% away from the entry point, it will not take the trade.
Pivot Low Minimum
Sometimes when searching for the pivot low, the script's defined lookback may not be enough to find the proper pivot point.
This can cause improper placement of stop losses and take profits and may cause trades to be exited early before they can fully play out in your favor.
Pivot Low Minimum is an input used to combat this problem, when the script finds a pivot low that does not meet the minimum percentage away from the entry point, it will then turn to Pivot Low 2 input in order to gain a further lookback and grab the correct pivot point to set your stop loss and take profits with.
When reading and setting this input, understand that setting it to 1 means there is no minimum, setting it to 0.9 would mean the minimum is a 10% difference between the pivot low and your entry point.
Think of it in terms of decimals and their equivalent percentage, 0.1 is equal to 10%, 0.01 is equal to 1%.
Whatever percentage you want to set for a minimum, convert it to a decimal, then simply subtract it from 1.
Example: Say you desire a 1.5% minimum pivot low and as a result an equivalent stop loss of 1.5% below your long entry and furthermore a take profit 1.5% above your long entry since the script uses a 1:1 ratio. Converting 1.5% to a decimal would give you 0.015, then subtracting it from 1 would give you 0.985, this would be the input assigned to Pivot Low Minimum.
Pivot High Minimum
Sometimes when searching for the pivot high, the script's defined lookback may not be enough to find the proper pivot point.
This can cause improper placement of stop losses and take profits and may cause trades to be exited early before they can fully play out in your favor.
Pivot High Minimum is an input used to combat this problem, when the script finds a pivot high that does not meet the minimum percentage away from the entry point, it will then turn to Pivot High 2 input in order to gain a further lookback and grab the correct pivot point to set your stop loss and take profits with.
When reading and setting this input, understand that setting it to 1 means there is no minimum, setting it to 0.9 would mean the minimum is a 10% difference between the pivot high and your entry point.
Think of it in terms of decimals and their equivalent percentage, 0.1 is equal to 10%, 0.01 is equal to 1%.
Whatever percentage you want to set for a minimum, convert it to a decimal, then simply subtract it from 1.
Example: Say you desire a 1.5% minimum pivot high and as a result an equivalent stop loss of 1.5% above your short entry and furthermore a take profit 1.5% below your short entry since the script uses a 1:1 ratio. Converting 1.5% to a decimal would give you 0.015, then subtracting it from 1 would give you 0.985, this would be the input assigned to Pivot High Minimum.
Summary of Input Group: Pivot Low/High - Pivot Low/High 2 – Pivot Low/High Risk Tolerance – Pivot Low/High Minimum
The first key takeaway from all these inputs is that your stop losses and take profits will be directly affected through optimizing any of them. The second key takeaway is that these inputs are crucial in managing the risk in your strategy, and while this has been said many times throughout the guide for various inputs, when it comes to stop losses and take profits it is especially true. Having a stop loss which is too high opens up the possibility for much bigger losses, and as a result your take profits will also be too high, minimizing the chance of any of them being hit. Having a stop loss which is too low increases the chance that your trade will get stopped out preemptively, before the trade can mature and move in your favor because remember that trades will not always move immediately in the intended direction, a good amount of patience is often involved in creating consistent successful trades and a successful strategy as such. On the same note, too low of a stop loss could also mean you are missing out on unrealized profit since your take profits are a direct result of the stop loss which is found. When optimizing your pivot low/high risk tolerance, think not about how much you are willing to lose on a single trade, but how much your portfolio can actually afford to lose not just on a single trade but multiple trades, sometimes even in a row. Obviously, the goal in creating a strategy is that you avoid losing trades and especially multiple in a row, however, there are many things that can’t be accounted for. The only way to manage this unaccounted risk is to use proper risk management and not open yourself up to big losses even in the worst most unlikely scenarios. Even if you don’t lose multiple trades in a row, ask yourself, could I afford to lose multiple trades with the risk tolerance I have set if everything were to go to $hit, (hopefully it would not), but in the off chance it did, instead of beating yourself up over what you did wrong, you’ll be patting yourself on the back for what you did right.
TP2-4 Long Placement
The first thing to understand about the take profit placement is that our system of stop losses and take profits uses a 1:1 risk to reward ratio for the first stop loss and first take profit.
This means that if your stop loss falls 2% below your long entry, your first take profit will be 2% above your long entry, hence 1:1.
As for take profits 2-4, they are just extensions of that ratio. This means that if TP2 Long Placement is set to 1.5, the ratio for your second take profit is 1:1.5.
Using the same percentage from the second bullet point being 2%, we can now gather that with a 1:1.5 ratio our second take profit would be at 3% above our long entry.
The same applies for the rest of the take profits, meaning whatever the take profit is set at regardless of which one, apply that number to the second placeholder of the ratio.
Example: First stop loss falls 2% below long entry. TP2 Long Placement input set to 1.5; risk to reward ratio is 1:1.5; corresponding percentage would be a 3% gain. TP3 Long Placement input set to 2; risk to reward ratio is 1:2; corresponding percentage would be a 4% gain. TP4 Long Placement input set to 2.5; risk to reward ratio is 1:2.5; corresponding percentage would be a 5% gain.
The next key thing to understand about the trailing take profits system is the position size being sold at each take profit and therefore how the strategy tracker calculates your strategy's profit.
At the first take profit, 50% of your position is being calculated as sold, locking in good profits off the bat.
At TP2, 20% of your position is being calculated as sold, leaving a remaining 30% open to gain more profit.
At TP3, another 20% of your position is being calculated as sold, leaving 10% to collect any additional possible gains.
At TP4 the remaining 10% of your position is sold and the trade will be fully closed out.
SL2-4 Long Placement
Our system of trailing stop losses is completely similar to that of our trailing take profits.
Just like the trailing take profits, the inputs for stop losses 2-4 are also used as the second placeholders in the risk to reward ratio.
This may be confusing since generally stop losses are associated with a loss on your position, however, the only stop loss which results in a loss on your position is the first one, not stop losses 2-4.
This is because once your first take profit is hit on your long, your stop loss will automatically move up to the price equivalent to the ratio which you set using these inputs that lies in profit.
Example: Since your first take profit will always be at a 1:1 risk to reward ratio with your stop loss, your second take profit could be at a 1:0.8 ratio. So, to clarify, once your first take profit is hit at a 1:1, your original first stop loss will now be moved up in profits to just below your first take profit at a 1:0.8 risk to reward ratio. This only happens AFTER the first take profit is hit.
For stop losses 3 and 4, the same logic is true, once TP2 is hit, your second stop loss will now be moved up to the placement of SL3 which will fall somewhere below TP2. Once TP3 is hit, your third stop loss will now be moved up to the placement of SL4 which will fall somewhere below TP3. If stop loss 4 does not get hit, then the only thing left to happen is for TP4 to hit and the trade will fully close out.
The one major difference between our system of trailing stop losses and take profits is that no matter what stop loss is hit, the entire remainder of your position will be calculated as sold.
So, if your first take profit hits and sells 50% of your long position, but the trade does not continue upwards and moves down to your second stop loss, the remaining 50% of your position will be calculated as sold.
The same applies to SL3 and SL4, so at SL3 the remaining 30% of your position will be calculated as sold, and at SL4 the remaining 10% will be calculated as sold.
Your trailing stop loss placement is dependent on what types of trades you desire. For shorter scalps on smaller timeframes, it's recommended to place each stop loss just below each corresponding take profit for long trades.
This way you leave just enough room for the trade to continue upwards if there is enough momentum, but you don’t open yourself up to losing your unrealized profit if it does not make this continuation.
If you desire longer swing trades on higher timeframes, it might be a good idea to leave more room in between the take profit and corresponding stop loss.
This way you leave more room for the trade to mature and move in your favor since when trading longer moves, often they will not shoot straight up but rather have a series of small pullbacks throughout the more general upwards trend.
Note that when a long trade is first entered the only stop loss and take profit in play are your original stop loss found by the pivot low which would result in a loss, and the first take profit at a 1:1 risk to reward ratio from that pivot low.
TP2-4 Short Placement
The first thing to understand about the take profit placement is that our system of stop losses and take profits uses a 1:1 risk to reward ratio for the first stop loss and first take profit.
This means that if your stop loss falls 2% above your short entry, your first take profit will be 2% below your short entry, hence, 1:1.
As for take profits 2-4, they are just extensions of that ratio. This means that if TP2 Short Placement is set to 1.5, the ratio for your second take profit is 1:1.5.
Using the same percentage from the second bullet point being 2%, we can now gather that with a 1:1.5 ratio our second take profit would be at 3% below our short entry.
The same applies for the rest of the take profits, meaning whatever the take profit is set at regardless of which one, apply that number to the second placeholder of the ratio.
Example: First stop loss falls 2% above short entry. TP2 Short Placement input set to 1.5; risk to reward ratio is 1:1.5; corresponding percentage would be a 3% gain. TP3 Short Placement input set to 2; risk to reward ratio is 1:2; corresponding percentage would be a 4% gain. TP4 Short Placement input set to 2.5; risk to reward ratio is 1:2.5; corresponding percentage would be a 5% gain.
The next key thing to understand about the trailing take profits system is the position size being sold at each take profit and therefore how the strategy tracker calculates your strategy's profit.
At the first take profit, 50% of your position is being calculated as sold, locking in good profits off the bat.
At TP2, 20% of your position is being calculated as sold, leaving a remaining 30% open to gain more profit.
At TP3, another 20% of your position is being calculated as sold, leaving 10% to collect any additional possible gains.
At TP4 the remaining 10% of your position is sold and the trade will be fully closed out.
SL2-4 Short Placement
Our system of trailing stop losses is completely similar to that of our trailing take profits.
Just like the trailing take profits, the inputs for stop losses 2-4 are also used as the second placeholders in the risk to reward ratio.
This may be confusing since generally stop losses are associated with a loss on your position, however, the only stop loss which results in a loss on your position is the first one, not stop losses 2-4.
This is because once your first take profit is hit on your short, your stop loss will automatically move down to the price equivalent to the ratio which you set using these inputs that lies in profit.
Example: Since your first take profit will always be at a 1:1 risk to reward ratio with your stop loss, your second take profit could be at a 1:0.8 ratio. So, to clarify, once your first take profit is hit at a 1:1, your original first stop loss will now be moved down in profits to just below your first take profit at a 1:0.8 risk to reward ratio. This only happens AFTER the first take profit is hit.
For stop losses 3 and 4, the same logic is true, once TP2 is hit, your second stop loss will now be moved down to the placement of SL3 which will fall somewhere above TP2. Once TP3 is hit, your third stop loss will now be moved down to the placement of SL4 which will fall somewhere above TP3. If stop loss 4 does not get hit, then the only thing left to happen is for TP4 to hit and the trade will fully close out.
The one major difference between our system of trailing stop losses and take profits is that no matter what stop loss is hit, the entire remainder of your position will be calculated as sold.
So, if your first take profit hits and sells 50% of your short position, but the trade does not continue downwards and moves up to your second stop loss, the remaining 50% of your position will be calculated as sold.
The same applies to SL3 and SL4, so at SL3 the remaining 30% of your position will be calculated as sold, and at SL4 the remaining 10% will be calculated as sold.
Your trailing stop loss placement is dependent on what types of trades you desire. For shorter scalps on smaller timeframes, it's recommended to place each stop loss just above each corresponding take profit for short trades.
This way you leave just enough room for the trade to continue downwards if there is enough momentum, but you don’t open yourself up to losing your unrealized profit if it does not make this continuation.
If you desire longer swing trades on higher timeframes, it might be a good idea to leave more room in between the take profit and corresponding stop loss.
This way you leave more room for the trade to mature and move in your favor since when trading longer moves, often they will not shoot straight down but rather have a series of small bounces throughout the more general downwards trend.
Note that when a short trade is first entered the only stop loss and take profit in play are your original stop loss found by the pivot high which would result in a loss, and the first take profit at a 1:1 risk to reward ratio from that pivot high.
Summary of Take Profit/Stop Loss Placement:
Correctly placed take profits and stop losses are essential in having a successful strategy and proper risk management. With that being said there are also many ways in which to use this system. Deciding how to set them up is really just a matter of determining the trading style you aim to succeed with. Once this has been determined, the placement of take profits and stop losses should be easier to configure. However, if there is any confusion on either of these topics as the ratios and corresponding TP/SL can get confusing, please do not hesitate to ask further questions in our discord!
Leverage Long
Leverage Long input simply defines the leverage used in your long positions, and is used in calculating the profit in Strategy Tracker
A rundown of risk associated with using leverage will not be given here since it should assume that if you're using leverage, you should already understand the risks.
If you are not using any leverage, then set Leverage Long input to 1.
Long Position Size
This input defines the position size you are using in your long trades.
This input is also used in calculating profit in Strategy Tracker.
Long Hedge Position Size
This input is used to define the position size of long hedge positions.
This input is also used in calculating profit in Strategy Tracker.
Important: Your Long Hedge Position Size should always be half of your Long Position Size for accurate profit calculation.
Double Long Position Size
This input is used to define the position size when in a double long.
This input is also used in calculating profit in Strategy Tracker
Important: Your Double Long Position Size should always be double your Long Position Size for accurate profit calculation.
Short Position Size
This input defines the position size you are using in your short trades.
This input is also used in calculating profit in Strategy Tracker.
Short Hedge Position Size
This input is used to define the position size of short hedge positions.
This input is also used in calculating profit in Strategy Tracker.
Important: Your Short Hedge Position Size should always be half of your Short Position Size for accurate profit calculation.
Double Short Position Size
This input is used to define the position size when in a double short.
This input is also used in calculating profit in Strategy Tracker
Important: Your Double Short Position Size should always be double your Short Position Size for accurate profit calculation.
A Message From the Developer PLEASE READ!!!
If you have made it this far in the guide, I applaud you and thank you for sticking with it as I know there is a lot of information here! This is not an exaggeration when I say there are hundreds of millions of possible variations that could be applied throughout all the inputs which is why I much prefer to call this a tool rather than an algorithm. Algorithm is a loaded word in my opinion as it comes with an implication of guarantee in the trades being made. This is not meant to discourage anybody from taking trades based off the tool which is also why I provided the option for automated alerts which through third party software can turn into automated trades; if you have the confidence in your strategy by all means I encourage you to trade it, automated or not. Just please understand that it's highly recommended to also apply your own knowledge and analysis before taking a trade as historical back testing data has its limitations and cannot always account for current market conditions. The real applicability does not fall in what the back tester window is saying you would have made or how accurate your strategy would have been, it's within the sheer number of markets and scenarios this tool can be used in and the information you can get which a human just can’t comprehend all at once; its literally endless. I urge all of you to be creative and think outside the box about what you can do with such a powerful tool at your fingertips. After all this is the reason why so many inputs were provided. Another main goal of this project was to give users a better understanding of risk management. It can be hard to manage your risk when it’s all kept in your head, but when you can modify your strategy to better manage your risk by simply optimizing a few inputs, it’s a lot easier to comprehend and actually apply when trading. The last thing I want to say is have fun working through the possible learning curve in using this tool, it may be a process but enjoy it because the one thing I can guarantee is that you will come out the other side a better trader than before!

Self-Optimizing RSI Strategy [Kioseff Trading]Hello!
Introducing the Self-Optimizing RSI Strategy.
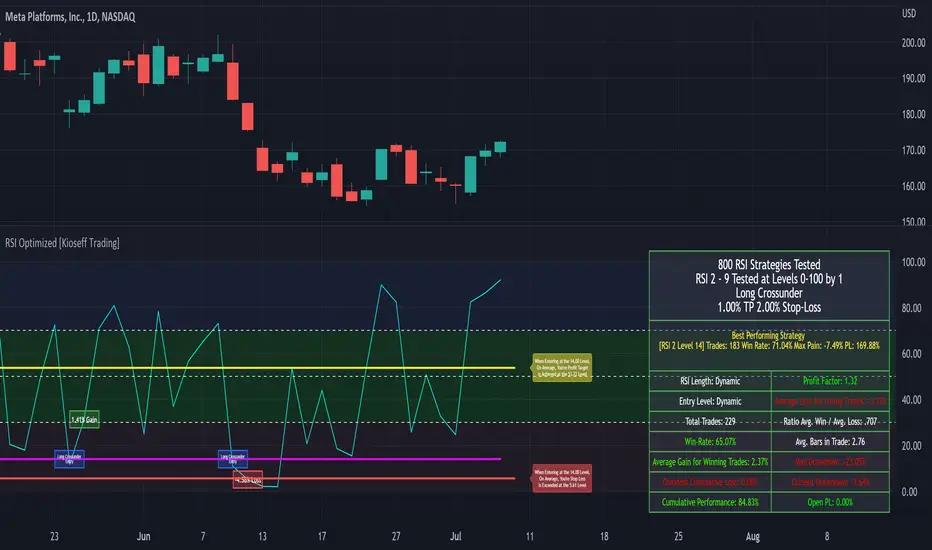
The indicator tests up to 800 RSI strategies simultaneously, looping through arrays, and auto plots the best performing parameter set.
The image above shows the result of 800 RSI strategies concurrently.
The table oriented bottom right shows the performance and risk metrics of the best performing RSI system tested across the bar set. Additionally, the conditions for entry and exit are displayed; for the image - a long entry system predicated on RSI crossunders and exit system predicated on a 1% TP and 2% SL are shown.
The indicator calculates numerous risk and performance metrics.
Calculated metrics include:
RSI Parameters
RSI Cross Entry Level
Total Trades
Win Rate
Avg. Gain for Winning Trades
Max Pain
PnL (Cumulative Performance)
Profit Factor
Avg. Loss for Losing Trades
Ratio Avg. Win / Avg. Loss
Avg. Bars in Trade
Max Drawdown
Current Drawdown
Open Position PnL
"Dynamic" indicates the performance of self-optimizing RSI system was tested.
The image above shows the performance of the greatest-performing RSI system - a fixed set of parameters - when adhering to a 1% TP and 2% fixed SL.
Trailing Stops and Profit-Taking Limit orders can be set/simulated.
The image above shows a dynamic entry level - plotted as a purple, non-transparent line.
The entry level "self-optimizes" to mimic the best performing RSI system at current time.
The image above exemplifies the functionality for all horizontal lines plotted on the chart.
The average RSI level achieved subsequent a profitable trade is shown.
The average RSI level achieved subsequent a losing trade is shown.
The entry level for RSI crossunders/crossovers is shown.
The image above show the Self-Optimizing RSI indicator recording entries & exits; gains & losses, for each executed trade.
You can "verify" trades manually.
Blue boxes reflect an entered position.
Green boxes reflect a closed, profitable trade.
Red boxes reflect a close, losing trade.
The percentage gain for a profitable trade is appended to green boxes; the percentage loss for a losing trade is appended to red boxes.
The Self-Optimizing RSI indicator plots off the chart; however, percentage gains/losses are measured against price, not RSI.
Boxes correlate to the interval a trade was entered/exited on.
The indicator hosts various methods to filter the outcome for testing.
For instance, you can:
Use trailing stops or fixed stop losses
Test RSI crossunders and crossovers
Configure the RSI settings that are tested (i.e. RSI 2 - 9, RSI 14 - 20, RSI 50 - 57)
Test short-based RSI Systems and long-based RSI systems
Simulate limit orders (Exit intrabar at fixed stop losses or trailing stop losses; exit intrabar at profit targets)
Require all tested RSIs to trend above or below their respective average (i.e. all RSIs must trend above/below their 50-interval EMA values. SMAs can also be used)
Use external indicators and require a user-defined value be exceeded, measured below, or that price exceed or measure below an indicator. The Self-Optimizing RSI indicator incorporates a few built-in technical indicators - ADX, %k, MFI, CMFI, and RSI. Consequently, you can require these indicators to measure above/below a specified level prior to entry. Additionally, you can supplement an extrinsic indicator (anything custom coded with plot values) to the entry logic for the Self-Optimizing RSI indicator. I'll show an example shortly.
Adjust the time window that's tested.
Adjust PT and SL percentages.
Override plot an RSI system to procure thorough statistics.
Require a symbol to measure above/Below or equal to a particular price level to “validate” a Long/Short entry signal. You can retrieve any data hosted by TradingView and require it measure above/below a user-defined level prior to entry. For instance, you can select "$VIX", and require the ticker to measure less than $30 prior to long/short entry. If "$VIX" measures greater than $30 prior to a long/short signal the position will not open. Alternatively, you can require a symbol to measure above a user-defined price prior to entry. If the retrieved ticker doesn't measure above the user-defined level prior to entry a trade will not open.
Use trailing stops or fixed stop losses
The image above shows results for 800 short-based RSI systems - using a trailing stop loss.
Test RSI crossunders and crossovers
The image shows results for 800 long-based RSI systems. Positions are entered subsequent to RSI crossovers.
You can select which RSI strategies are tested - you aren't not limited to testing RSI 2 - RSI 9 (:
Simulate limit orders (Exit intrabar at fixed stop losses or trailing stop losses; exit intrabar at profit targets)
The image above shows performance test results when exiting during the interval subsequent to the profit target being exceeded.
The image above shows performance test results when exiting during the interval subsequent to the stop loss being exceeded.
Require all tested RSIs to trend above or below their respective average (i.e. all RSIs must trend above/below their 50-interval EMA values. SMAs can also be used)
The image above shows an RSI EMA in addition to prerequisite condition. For each RSI strategy tested, the RSI used for the strategy must measure above an EMA of its values prior to entry. You can require RSI to measure below an EMA of its values prior to entry, use an SMA, and change the length of the MA used.
Use external indicators and require a user-defined value be exceeded, measured below, or that price exceed or measure below an indicator. The Self-Optimizing RSI indicator incorporates a few built-in technical indicators - ADX, %k, MFI, CMFI, and RSI. Consequently, you can require these indicators to measure above/below a specified level prior to entry. Additionally, you can supplement an extrinsic indicator (anything custom coded with plot values) to the entry logic for the Self-Optimizing RSI indicator. I'll show an example shortly.
The image above shows me requiring the ADX indicator to measure above "20" prior to long entry. Any of the built-indicators can be used with similar conditions; you can implement a custom-coded indicator for trade logic.
Additionally, you can supplement an extrinsic indicator (anything custom coded with plot values) to the entry logic for the Self-Optimizing RSI indicator.
The image above shows me retrieving the value for Volume Profile Point of Control - a TradingView coded indicator.
Consequently, I can require price to measure above/below the session's Poc prior to RSI long/short entry.
You can use this feature with any custom coded indicator providing historical plot values - something you or a favored author have coded.
]Adjust PT and SL percentages
The image above shows adjusted TP & SL percentages - optimize and reward/risk ratio you'd like (:
Override plot an RSI system to procure thorough statistics.
The image above shows manually plotted RSI parameters and a corresponding stat sheet.
Require a symbol to measure above/Below or equal to a particular price level to “validate” a Long/Short entry signal. You can retrieve any data hosted by TradingView and require it measure above/below a user-defined level prior to entry. For instance, you can select "$VIX", and require the ticker to measure less than $30 prior to long/short entry. If "$VIX" measures greater than $30 prior to a long/short signal the position will not open. Alternatively, you can require a symbol to measure above a user-defined price prior to entry. If the retrieved ticker doesn't measure above the user-defined level prior to entry a trade will not open.
The image above shows me requiring the ticker "$VIX" to measure below $30 prior to long/short entry. If %VIS measures greater than $30 when a long/short signal triggers a position will not be opened. Further refine your trading system with this feature - exploit correlations.
Adjust the time window that's tested.
The image above shows configurable start and end dates for the optimization period.
You won't be able to test 800 RSI strategies concomitantly on a 20,000 bar data set.
Consequently, for large data sets (intrasession data) you will have to narrow the optimization window to test a larger number of combinations.
You can test 80 (loads on all data sets), 144 (loads on all data sets), 264 (loads on ~15,000 bar data sets), 312 (loads on ~11,500 bar data sets) and 800 (loads on ~4950 bar data sets)combinations simultaneously. You can test 800 RSI strategies simultaneously on intrasession data; however, you'll likely have to narrow the tested time window.
I recently published a bar count script titled "Bar Count for Backtesting", you can access the script here:
The above script is useful for quickly calculating the number of bars in a time window, or the date for a bar that is "x" number of bars back. Therefore, implementing these scripts cooperatively should improve date selection efficiency (not arbitrarily selecting test start & end dates that fail to load).
I included a tool tip describing the near-maximum bars in a data set that the higher numbers of simultaneous RSI strategies can be tested on.
More to come; enjoy!
(P.S. The script uses private libraries and, consequently, is unable to be published open source)
An optimization script is best implemented to discover what won't work, not what will work. The best performing "optimized" parameters are not a guaranteed profitable investment system. While we may see an exceptionally positive performance for a set of parameters, it's impossible to know how much of that performance is the beneficiary of market noise in the absence of additional testing. Most market moves are noise - irreplicable sequences that offer no predictive utility - and most "good" backtests overwhelmingly benefit from these irreplicable sequences. An investor unfamiliar with this concept may be lead to believe they have found a valid correlation between an indicator sequence and subsequent price movement, despite the correlation being illusory.
Consequently, it should be assumed that the best performing parameters strongly benefitted from market noise and will not work in a live market - until further rigorous statistical tests are performed on an investment system built around the best performing parameters. This includes out-of-sample, in-sample, and forward testing in addition to testing negatively correlated, positively correlated and zero-correlation assets; testing additional assets should be treated as prerequisite to live implementation.
Of course, all trading strategies, even one's that methodically exploit a valid correlation/replicable sequence, will benefit from market noise - it's impossible to avoid. However, a "legit" trading strategy has a chance to work on future price data, while an overoptimized strategy will fail miserably on new price data!
An overoptimized strategy is virtually guaranteed to have a better backtest performance than a valid strategy. The overoptimized strategy will fail in a live market while the valid strategy has a chance of working. So, should you notice the best performing RSI parameters, be sure to build a comprehensive trading system around the parameters and perform additional tests. This is the only way to know if the optimized parameters will truly work in a live market!
Unfortunately, they often will not!
This publication does not constitute investment advice.
[FN] Strategy - Store Level on ConditionThis is a function that you can use in strategies. Not a strategy in and of itself.
Example thumbnail is showing the function applied to a strategy.
Oftentimes, I am asked a question regarding how to hold a variable at a specific, constant level over a conditional period of time. This question is always asked in a very long convoluted way like "I want the strategy to know what the high of the last pivot was while I'm in a long." or some other variation of wanting a script to remember something from prior bars.
This function is designed to store a price or some numeric level on the bar that your conditional (bool) statements determine that it should be stored. In this construct, you would set conditional statement(s) to flip the 'hold condition' to be true on the next bar, then hold that value until either the "hold condition" is no longer true or the initial conditions trigger again, causing an update to the level that you want to capture.
You still have to come up with the logic for the start condition and hold condition on your own, but I've provided an example that should give you an idea of how to accomplish this and customize/deploy the function for your purposes.
The function will return 'na' when neither the start condition nor hold condition are true. There's multiple ways to implement this and variations on how the level is chosen. I've written extensive notes in the script to guide you through the logic behind the function. My hope is that it will be useful to those trying to build strategies or anyone attempting to get their script to remember a level under given conditions.
In the thumbnail example, the take profit level is defined at the beginning of the trade and held until the take profit order executes. The order execution is a separate matter. However, storing the take-profit level at a static value is key to telling the strategy.exit() function what price to execute a limit exit order at.
Example: strategy.exit("Exit Long", from_entry = "long", qty_percent = 100, limit = stored_value)
Let me know how it works out for you and if I can be of any assistance.
Note: Strategy results are mainly derived from the fact that the strategy is long-only, the NQ only goes up, and there is no stop loss in place. So don't ask for the specific strategy, because unless you're trading a single contract with a $500,000 account, you'll probably get liquidated using this strategy as it is presented.

Democratic MultiAsset Strategy [BerlinCode42]Happy Trade,
Intro
Included Trade Concept
Included Indicators and Compare-Functions
Usage and Example
Settings Menu
Declaration for Tradingview House Rules on Script Publishing
Disclaimer
Conclusion
1. Intro
This is the first multi-asset strategy available on TradingView—a market breadth multi-asset trading strategy with integrated webhooks, backtesting capabilities, and essential strategy components like Take Profit, Stop Loss, Trailing, Hedging, Time & Session Filters, and Alerts.
How It Trades? At the start of each new bar, one asset from a set of eight is selected to go long or short. As long there is available cash and the selected asset meets the minimum criteria.
The selection process works through a voting system, similar to a democracy. Each asset is evaluated using up to five indicators that the user can choose. The asset with the highest overall voting score is picked for the trade. If no asset meets all criteria, no trade is executed, and the cash reserve remains untouched for future opportunities.
How to Set Up This Market Breadth Strategy:
Choose eight assets from the same market (e.g., cryptos or big tech stocks).
Select one to five indicators for the voting system.
Refine the strategy by adjusting Take Profit, Stop Loss, Hedging, Trailing, and Filters.
2. Voting as the included Trade Concept
The world of financial trading is filled with both risks and opportunities, and the key challenge is to identify the right opportunities, manage risks, and do both right on time.
There are countless indicators designed to spot opportunities and filter out risks, but no indicator is perfect—they only work statistically, hitting the right signals more often than the wrong ones.
The goal of this strategy is to increase the accuracy of these Indicators by:
Supervising a larger number of assets
Filtering out less promising opportunities
This is achieved through a voting system that compares indicator values across eight different assets. It doesn't just compare long trades—it also evaluates long vs. short positions to identify the most promising trade.
Why focus on one asset class? While you can randomly select assets from different asset classes, doing so prevents the algorithm from identifying the strongest asset within a single class. Think about, within one asset class there is often a major trend whereby different asset classes has not really such behavior.
And, you don’t necessarily need trading in multiple classes—this algorithm is designed to generate profits in both bullish and bearish markets. So when ever an asset class rise or fall the voting system ensure to jump on the strongest asset. So this focusing on one asset class is an integral part of this strategy. This all leads to more stable and robust trading results compared to handling each asset separately.
3. Included Indicators and Compare-Functions
You can choose from 17 different indicators, each offering different types of signals:
Some provide a directional signal
Some offer a simple on/off signal
Some provide both
Available Indicators: RSI, Stochastic RSI, MFI, Price, Volume, Volume Oscillator, Pressure, Bilson Gann Trend, Confluence, TDI, SMA, EMA, WMA, HMA, VWAP, ZLMA, T3MA
However, these indicators alone do not generate trade signals. To do so, they must be compared with thresholds or other indicators using specific comparison functions.
Example – RSI as a Trade Signal. The RSI provides a value between 0 and 100. A common interpretation is:
RSI over 80 → Signal to go short or exit a long trade
RSI under 20 → Signal to go long or exit a short trade
Here, two comparison functions and two thresholds are used to determine trade signals.
Below is the full set of available comparison functions, where: I represents the indicator’s value and A represents the comparator’s value.
I < A if I smaller A then trade signal
I > A if I bigger A then trade signal
I = A if I equal to A then trade signal
I != A if I not equal to A then trade signal
A <> B if I bigger A and I smaller B then trade signal
A >< B if I smaller A then long trade signal or if I bigger B then short trade signal
Image 1
In Image 1, you can see one of five input sections, where you define an indicator along with its function, comparator, and constants. For our RSI example, we select:
Indicator: RSI
Function: >< (greater/less than)
Comparator: Constant
Constants: A = 20, B = 80
With these settings a go short signal is triggered when RSI crosses above 80. And a go long signal is triggered when RSI crosses below 20.
Relative Strength Indicator: The RSI from the public TradingView library provides a directional trade signal. You can adjust the price source and period length in the indicator settings.
Stochastic Relative Strength Indicator: As above the Stoch RSI offers a trade signal with direction. It is calculated out of the RSI, the stochastic derivation and the SMA from the Tradingview library. You can set the in-going price source and the period length for the RSI, for the Stochastic Derivation and for the SMA as blurring in the Indicator settings section.
Money Flow Indicator: As above the MFI from the public Tradingview library offers a trade signal with direction. You can set the in-going price source and the period length in the Indicator settings section.
Price: The Price as Indicator is as simple as it can be. You can chose Open, High, Low or Close or combinations of them like HLC3 or even you can import an external Indicator. The absolute price or value can later be used to generate a trade signals when certain constant thresholds or other indicators signals are crossed.
Volume: Similar as above the Volume as Indicator offers the average volume as absolute value. You can set the period length for the smoothing and you can chose where it is presented in the base currency $ or is the other. For example the trade pair BTCUSD you can chose to present the value in $ or in BTC.
Volume Oscillator: The Volume Oscillator Indicator offers a value in the range of . Whereby a value close to 0 means that the volume is very low. A value around 1 means the volume is same high as before and Values higher as 1 means the volume is bigger then before. You can set the period length for the smoothing and you can chose where it is presented in the base currency $ or is the other. For example the trade pair BTCUSD you can chose to present the value in $ or in BTC.
Pressure Indicator: The Pressure is an adapted version of LazyBear's script (Squeeze Momentum Indicator) Pressure is a Filter that highlight bars before a bigger price move in any direction. The result are integer numbers between 0 and 4 whereby 0 means no bigger price move excepted, while 4 means huge price move expected. You can set the in-going price source and the period length in the Indicator settings section.
Bilson Gann Trend: The Bilson Gann Trend Indicator is a specific re-implementation of the widely known Bilson Gann Count Algorithm to detect Highs and Lows. On base of the last four Highs and Lows a trend direction can be calculated. It is based on 2 rules to confirm a local pivot candidate. When a local pivot candidate is confirmed, let it be a High then it looks for Lows to confirm. The result range is whereby -1 means down trend, 1 means uptrend and 0 sideways.
Confluence: The Confluence Indicator is a simplified version of Dale Legan's "Confluence" indicator written by Gary Fritz. It uses five SMAs with different periods lengths. Whereby the faster SMA get compared with the (slower) SMA with the next higher period lengths. Is the faster SMA smaller then the slower SMA then -1, otherwise +1. This is done with all SMAs and the final sum range between . Whereby values around 0 means price is going side way, Crossing under 0 means trend change from bull to bear. Is the value>2 means a strong bull trend and <-2 a strong bear trend.
Trades Dynamic Index: The TDI is an adapted version from the "Traders Dynamic Index" of LazyBear. The range of the result is whereby 2 means Top goShort, -2 means Bottom goLong, 0 is neutral, 1 is up trend, -1 is down trend.
Simple Moving Average: The SMA is the one from the Tradingview library. You can compare it with the last close price or any other moving average indicator to indicate up and down trends. You can set the in-going price source and the period length in the Indicator settings section.
Exponential Moving Average: The EMA as above is the one from the Tradingview library. You can compare it with the last close price or any other moving average indicator to indicate up and down trends. You can set the in-going price source and the period length in the Indicator settings section.
Weighted Moving Average: The WMA as above is the one from the Tradingview library. You can compare it with the last close price or any other moving average indicator to indicate up and down trends. You can set the in-going price source and the period length in the Indicator settings section.
Hull Moving Average: HMA as above is the one from the Tradingview library. You can compare it with the last close price or any other moving average indicator to indicate up and down trends. You can set the in-going price source and the period length in the Indicator settings section.
Volume Weighted Average Price: The VWAP as above is the one from the Tradingview library. You can compare it with the last close price or any other moving average indicator to indicate up and down trends. You can set the in-going price source in the Indicator settings section.
Zero Lag Moving Average: The ZLMA by John Ehlers and Ric Way describe in their paper: www.mesasoftware.com
As the other moving averages you can compare it with the last close price or any other moving average indicator to indicate up and down trends. You can set the in-going price source and the period length in the Indicator settings section.
T3 Moving Average: The T3MA is the one from the Tradingview library. You can compare it with the last close price or any other moving average indicator to indicate up and down trends. You can set the in-going price source, the period length and a factor in the Indicator settings section. Keep this factor at 1 and the T3MA swing in the same range as the input. Bigger 1 and it swings over. Factors close to 0 and the T3MA becomes a center line.
All MA's following the price. The function to compare any MA Indicators would be < or > to generate a trade direction. An example follows in the next section.
4. Example and Usage
In this section, you see how to set up the strategy using a simple example. This example was intentionally chosen at random and has not undergone any iterations to refine the trade results.
We use the RSI as the trade signal indicator and apply a filter using a combination of two moving averages (MAs). The faster MA is an EMA, while the slower MA is an SMA. By comparing these two MAs, we determine a trend direction. If the faster MA is above the slower MA the trend is upwards etc. This trend direction can then be used for filtering trades.
The strategy follows these rules:
If the RSI is below 20, a buy signal is generated.
If the RSI is above 80, a sell signal is generated.
However, this RSI trade signal is filtered so that a trade is only given the maximum voting weight if the RSI trade direction aligns with the trend direction determined by the MA filter.
So first, you need to add your chosen assets or simply keep the default ones. In Image 2, you can see one of the eight asset input sections.
Image 2
This strategy offers some general trade settings that apply equally to all assets and some asset-specific settings. This distinction is necessary because some assets have higher volatility than others, requiring asset-specific Take Profit and Stop Loss levels.
Once you have made your selections, proceed to the Indicators and Compare Functions for the voting. Image 3 shows an example of this setup.
Image 3
Later on go to the Indicator specific settings shown in Image 4 to refine the trade results.
Image 4
For refine the trade results take also a look on the result summary table, development of capital plot, on the list of closed and open trades and screener table shown in Image 5.
Image 5
To locate any trade for any asset in the chronological and scroll-able trade list, each trade is marked with a label:
An opening label displaying the trade direction, ticker ID, trade number, invested amount, and remaining cash reserves.
A closing label showing the closing reason, ticker ID, trade number, trade profit (%), trade revenue ($), and updated cash reserves.
Additionally: a green line marks each Take Profit level. An orange line indicates the (trailing) Stop Loss.
The summary table in the bottom-left corner provides insights into how effective the trade strategy is. By analyzing the trade list, you can identify trades that should be avoided.
To find those bad trades on the chart, use the trade number or timestamp. With replay mode, you can go back in time to review a specific trade in detail.
Image 6
In Image 6, you can see an example where replay mode and the start time filter are used to display specific trades within a narrow time range. By identifying a large number of bad trades, you may recognize patterns and formulate conditions to avoid them in the future.
This is the backtesting tool that allows you to develop and refine your trading strategy continuously. With each iteration—from general adjustments to detailed optimizations—you can use these tools to improve your strategy. You can:
Add other indicators with trade signals and direction
Add more indicators signals as filter
Adjust the settings of your indicators to optimize results
Configure key strategy settings, such as Time and Session Filters, Stop Loss, Take Profit, and more
By doing so, you can identify a profitable strategy and its optimal settings.
5. Settings Menu
In the settings menu you will find the following high-lighted sections. Most of the settings have a i mark on their right side. Move over it with the cursor to read specific explanation.
Backtest Results: Here you can decide about visibility of the trade list, of the Screener Table and of the Results Summary. And the colors for bullish, side ways, bearish and no signal. Go above and see Image 5.
Time Filter: You can set a Start time or deactivate it by leave it unhooked. The same with End Time and Duration Days . Duration Days can also count from End time in case you deactivate Start time.
Session Filter: Here, you can chose to activate trading on a weekly basis, specifying which days of the week trading is allowed and which are excluded. Additionally, you can configure trading on a daily basis, setting the start and end times for when trades are permitted. If activated, no new trades will be initiated outside the defined times and sessions.
Trade Logic: Here you can set an extra time frame for all indicators. You can enable Longs or Shorts or both trades.
The min Criteria percentage setting defines the minimum number of voices an asset has to get to be traded. So if you set this to 50% or less also weak winners of the voting get traded while 100% means that the winner of the voting has to get all possible voices.
Additionally, you have the option to delay entry signals. This feature is particularly useful when trade signals exhibit noise and require smoothing.
Enable Trailing Stop and force the strategy to trade only at bar closing. Other-ways the strategy trade intrabar, so when ever a voting present an asset to trade, it will send the alert and the webhooks.
The Hedging is basic as shown in the following Image 7 and serves as a catch if price moves fast in the wrong direction. You can activate a hedging mechanism, which opens a trade in the opposite direction if the price moves x% against the entry price. If both the Stop Loss and Hedging are triggered within the same bar, the hedging action will always take precedence.
Image 6
Indicators to use for Trade Signal Generating: Here you chose the Indicators and their Compare Function for the Voting . Any activated asset will get their indicator valuation which get compared over all assets. The asset with the highest valuation is elected for the trade as long free cash is present and as long the minimum criteria are met.
The Screener Table will show all indicators results of the last bar of all assets. Those indicator values which met the threshold get a background color to high light it. Green for bullish, red for bearish and orange for trade signals without direction. If you chose an Indicator here but without any compare function it will show also their results but with just gray background.
Indicator Settings: here you can setup the indicator specific settings. for deeper insights see 3. Included Indicators and Compare-Functions .
Assets, TP & SL Settings: Asset specific settings. Chose here the TickerID of all Assets you wanna trade. Take Profit 1&2 set the target prices of any trade in relation to the entry price. The Take Profit 1 exit a part of the position defined by the quantity value. Stop Loss set the price to step out when a trade goes the wrong direction.
Invest Settings: Here, you can set the initial amount of cash to start with. The Quantity Percentage determines how much of the available cash is allocated to each trade, while the Fee percentage specifies the trading fee applied to both opening and closing positions.
Webhooks: Here, you configure the License ID and the Comment . This is particularly useful if you plan to use multiple instances of the script, ensuring the webhooks target the correct positions. The Take Profit and Stop Loss values are displayed as prices.
6. Declaration for Tradingview House Rules on Script Publishing
The unique feature of this Democratic Multi-Asset Strategy is its ability to trade multiple assets simultaneously. Equipped with a set of different standard Indicators, it's new democratic Voting System does more robust trading decisions compared to single-asset. Interchangeable Indicators and customizable strategy settings allowing for a wide range of trading strategies.
This script is closed-source and invite-only to support and compensate for over a year of development work. Unlike other single asset strategies, this one cannot use TradingView's strategy functions. Instead, it is designed as an indicator.
7. Disclaimer
Trading is risky, and traders do lose money, eventually all. This script is for informational and educational purposes only. All content should be considered hypothetical, selected post-factum and is not to be construed as financial advice. Decisions to buy, sell, hold, or trade in securities, commodities, and other investments involve risk and are best made based on the advice of qualified financial professionals. Past performance does not guarantee future results. Using this script on your own risk. This script may have bugs and I declare don't be responsible for any losses.
8. Conclusion
Now it’s your turn! Chose an asset class and pick 8 of them and chose some indicators to see the trading results of this democratic voting system. Refine your multi-asset strategy to favorable settings. Once you find a promising configuration, you can set up alerts to send webhooks directly. Configure all parameters, test and validate them in paper trading, and if results align with your expectations, you even can deploy this script as your trading bit.
Cheers

Uptrick: Portfolio Allocation DiversificationIntro
The Uptrick: Portfolio Allocation Diversification script is designed to help traders and investors manage multiple assets simultaneously. It generates signals based on various trading systems, allocates capital using different diversification methods, and displays real-time metrics and performance tables on the chart. The indicator compares active trading strategies with a separate long-term holding (HODL) simulation, allowing you to see how a systematic trading approach stacks up against a simple buy-and-hold strategy.
------------------------------------------------------------------------
Trading System Selection
1. No signals (none)
In this mode, the script does not produce bullish or bearish indicators; every asset stays in a neutral stance. This setup is useful if you prefer to observe how capital might be distributed based solely on the chosen diversification method, with no influence from directional signals.
2. rsi – neutral
This mode uses an index-based measure of whether an asset appears overbought or oversold. It generates a bearish signal if market conditions point to overbought territory, and a bullish signal if they indicate oversold territory. If neither extreme surfaces, it remains neutral. Some traders apply this in sideways or range-bound conditions, where overbought and oversold levels often hint at possible turning points. It does not specifically account for divergence patterns.
3. rsi – long only
In this setting, the system watches for instances where momentum readings strengthen even if the asset’s price is still under pressure or setting new lows. It also considers oversold levels as potential signals for a bullish setup. When such conditions emerge, the script flags a possible move to the upside, ignoring indications that might otherwise suggest a bearish trend. This approach is generally favored by those who want to concentrate exclusively on identifying price recoveries.
4. rsi – short only
Here, the script focuses on spotting signs of deteriorating momentum while an asset’s price remains relatively high or attempts further gains. It also checks whether the market is drifting into overbought territory, suggesting a potential decline. Under such conditions, it issues a bearish signal. It provides no bullish alerts, making it particularly suitable for traders who look to take advantage of overvalued scenarios or protect themselves against sudden downward moves.
5. Deviation from fair value
Under this system, the script judges how far the current price may have strayed from what is considered typical, taking into account normal fluctuations. If the asset appears to be trading at an unusually low level compared to that reference, it is flagged as bullish. If it seems abnormally high, a bearish signal is issued. This can be applied in various market environments to seek opportunities that arise from perceived mispricing.
6. Percentile channel valuation
In this mode, the script determines where an asset's price stands within a historical distribution, highlighting whether it has reached unusually high or low territory compared to its recent past. When the price reaches what is deemed an extreme reading, it may indicate that a reversal is more likely. This approach is often used by traders who watch for statistical outliers and potential reversion to a more typical trading range.
7. ATH valuation
This technique involves comparing an asset's current price with its previously recorded peak values. The script then interprets whether the price is positioned so far below the all-time high that it looks discounted, or so close to that high that it could be overextended. Such perspective is favored by market participants who want to see if an asset still has ample room to climb before matching historic extremes, or if it is nearing a possible ceiling.
8. Z-score system
Here, the script measures how far above or below a standard reference average an asset's price may be, translated into standardized units. Substantial negative readings can suggest a price that might be unusually weak, prompting a bullish indication, while large positive readings could signal overextension and lead to a bearish call. This method is useful for traders watching for abrupt deviations from a norm that often invite a reversion to more balanced levels.
RSI Divergence Period
This input is particularly relevant for the RSI - Long Only and RSI - Short Only modes. The period determines how many bars in the past you compare RSI values to detect any divergences.
------------------------------------------------------------------------
Diversification Method
Once the script has determined a bullish, bearish, or neutral stance for each asset, it then calculates how to distribute capital among all included assets. The diversification method sets the weighting logic.
1. None
Gives each asset an equal weight. For example, if you have five included assets, each might get 20 percent. This is a simple baseline.
2. Risk-Adjusted Expected Return Using Volatility Clustering
Emphasizes each asset’s average returns relative to its observed risk or volatility tendencies. Assets that exhibit good risk-adjusted returns combined with moderate or lower volatility may receive higher weights than more volatile or less appealing assets. This helps steer capital toward assets that have historically provided a better ratio of return to risk.
3. Relative Strength
Allocates more capital to assets that show stronger price strength compared to a reference (for example, price above a long-term moving average plus a higher RSI). Assets in clear uptrends may be given higher allocations.
4. Trend-Following Indicators
Examines trend-based signals, like positive momentum measurements or upward-trending strength indicators, to assign more weight to assets demonstrating strong directional moves. This suits those who prefer to latch onto trending markets.
5. Volatility-Adjusted Momentum
Looks for assets that have strong price momentum but relatively subdued volatility. The script tends to reward assets that are trending well yet are not too volatile, aiming for stable upward performance rather than massive swings.
6. Correlation-Based Risk Parity
Attempts to weight assets in such a way that the overall portfolio risk is more balanced. Although it is not an advanced correlation matrix approach in a strict sense, it conceptually scales each asset’s weight so no single outlier heavily dominates.
7. Omega Ratio Maximization
Gives preference to assets with higher omega ratios. This ratio can be interpreted as the probability-weighted gains versus losses. Assets with a favorable skew are given more capital.
8. Liquidity-Weighted Valuation
Considers each asset’s average trading liquidity, such as the combination of volume and price. More liquid assets typically receive a higher allocation because they can be entered or exited with lower slippage. If the trading system signals bullishness, that can further boost the allocation, and if it signals bearishness, the allocation might be set to zero or reduced drastically.
9. Drawdown-Controlled Allocation (DCA)
Examines each asset’s maximum drawdown over a recent window. Assets experiencing lighter drawdowns (thus indicating somewhat less downside volatility) receive higher allocations, aiming for a smoother overall equity curve.
------------------------------------------------------------------------
Portfolio and Allocation Settings
Portfolio Value
Defines how much total capital is available for the strategy-based investment portion. For example, if set to 10,000, then each asset’s monetary allocation is determined by the percentage weighting times 10,000.
Use Fixed Allocation
When enabled, the script calculates the initial allocation percentages after 50 bars of data have passed. It then locks those percentages for the remainder of the backtest or real-time session. This feature allows traders to test a static weighting scenario to see how it differs from recalculating weights at each bar.
------------------------------------------------------------------------
HODL Simulator
The script has a separate simulation that accumulates positions in an asset whenever it appears to be recovering from an undervalued state. This parallel tracking is intended to contrast a simple buy-and-hold approach with the more adaptive allocation methods used elsewhere in the script.
HODL Buy Quantity
Each time an asset transitions from an undervalued state to a recovery phase, the simulator executes a purchase of a predefined quantity. For example, if set to 0.5 units, the system will accumulate this amount whenever conditions indicate a shift away from undervaluation.
HODL Buy Threshold
This parameter determines the level at which the simulation identifies an asset as transitioning out of an undervalued state. When the asset moves above this threshold after previously being classified as undervalued, a buy order is triggered. Over time, the performance of these accumulated positions is tracked, allowing for a comparison between this passive accumulation method and the more dynamic allocation strategy.
------------------------------------------------------------------------
Asset Table and Display Settings
The script displays data in multiple tables directly on your chart. You can toggle these tables on or off and position them in various corners of your TradingView screen.
Asset Info Table Position
This table provides key details for each included asset, displaying:
Symbol – Identifies the trading pair being monitored. This helps users keep track of which assets are included in the portfolio allocation process.
Current Trading Signal – Indicates whether the asset is in a bullish, bearish, or neutral state based on the selected trading system. This assists in quickly identifying which assets are showing potential trade opportunities.
Volatility Approximation – Represents the asset’s historical price fluctuations. Higher volatility suggests greater price swings, which can impact risk management and position sizing.
Liquidity Estimate – Reflects the asset’s market liquidity, often based on trading volume and price activity. More liquid assets tend to have lower transaction costs and reduced slippage, making them more favorable for active strategies.
Risk-Adjusted Return Value – Measures the asset’s returns relative to its risk level. This helps in determining whether an asset is generating efficient returns for the level of volatility it experiences, which is useful when making allocation decisions.
2. Strategy Allocation Table Position
Displays how your selected diversification method converts each asset into an allocation percentage. It also shows how much capital is being invested per asset, the cumulative return, standard performance metrics (for example, Sharpe ratio), and the separate HODL return percentage.
Symbol – Displays the asset being analyzed, ensuring clarity in allocation distribution.
Allocation Percentage – Represents the proportion of total capital assigned to each asset. This value is determined by the selected diversification method and helps traders understand how funds are distributed within the portfolio.
Investment Amount – Converts the allocation percentage into a dollar value based on the total portfolio size. This shows the exact amount being invested in each asset.
Cumulative Return – Tracks the total return of each asset over time, reflecting how well it has performed since the strategy began.
Sharpe Ratio – Evaluates the asset’s return in relation to its risk by comparing excess returns to volatility. A higher Sharpe ratio suggests a more favorable risk-adjusted performance.
Sortino Ratio – Similar to the Sharpe ratio, but focuses only on downside risk, making it more relevant for traders who prioritize minimizing losses.
Omega Ratio – Compares the probability of achieving gains versus losses, helping to assess whether an asset provides an attractive risk-reward balance.
Maximum Drawdown – Measures the largest percentage decline from an asset’s peak value to its lowest point. This metric helps traders understand the worst-case loss scenario.
HODL Return Percentage – Displays the hypothetical return if the asset had been bought and held instead of traded actively, offering a direct comparison between passive accumulation and the active strategy.
3. Profit Table
If the Profit Table is activated, it provides a summary of the actual dollar-based gains or losses for each asset and calculates the overall profit of the system. This table includes separate columns for profit excluding HODL and the combined total when HODL gains are included. As seen in the image below, this allows users to compare the performance of the active strategy against a passive buy-and-hold approach. The HODL profit percentage is derived from the Portfolio Value input, ensuring a clear comparison of accumulated returns.
4. Best Performing Asset Table
Focuses on the single highest-returning or highest-profit asset at that moment. It highlights the symbol, the asset’s cumulative returns, risk metrics, and other relevant stats. This helps identify which asset is currently outperforming the rest.
5. Most Profitable Asset
A simpler table that underscores the asset producing the highest absolute dollar profit across the portfolio.
------------------------------------------------------------------------
Multi Asset Selection
You can include up to ten different assets (such as BTCUSDT, ETHUSDT, ADAUSDT, and so on) in this script. Each asset has two inputs: one to enable or disable its inclusion, and another to select its trading pair symbol. Once you enable an asset, the script requests the relevant market data from TradingView.
------------------------------------------------------------------------
Uniqness and Features
1. Multiple Data Fetches
Each asset is pulled from the chart’s timeframe, along with various metrics such as RSI, volatility approximations, and trend indicators.
2. Various Risk and Performance Metrics
The script internally keeps track of different measures, like Sharpe ratio (a measure of average return adjusted for risk), Sortino ratio (which focuses on downside volatility), Omega ratio, and maximum drawdown. These metrics feed into the strategy allocation table, helping you quickly assess the risk-and-return profile of each asset.
3. Real-Time Tables
Instead of having to set up complex spreadsheets or external dashboards, the script updates all tables on every new bar. The color schemes in these tables are designed to draw attention to bullish or bearish signals, positive or negative returns, and so forth.
4. HODL Comparison
You can visually compare the active strategy’s results to a separate continuous buy-on-dips accumulation strategy. This allows for insight into whether your dynamic approach truly beats a simpler, more patient method.
5. Locking Allocations
The Use Fixed Allocation input is convenient for those who want to see how holding a fixed distribution of capital performs over time. It helps in distinguishing between constant rebalancing vs a fixed, set-and-forget style.
------------------------------------------------------------------------
How to use
1. Add the Script to Your Chart
Once added, open the settings panel to configure your asset list, choose a trading system, and select the diversification approach.
2. Select Assets
Pick up to ten symbols to monitor. Disable any you do not want included. Each included asset is then handled for signals, diversification, and performance metrics.
3. Choose Trading System
Decide if you prefer RSI-based signals, a fair-value approach, or a percentile-based method, among others. The script will then flag assets as bullish, bearish, or neutral according to that selection.
4. Pick a Diversification Method
For example, you might choose Trend-Following Indicators if you believe momentum stocks or cryptocurrencies will continue their trends. Or you could use the Omega Ratio approach if you want to reward assets that have had a favorable upside probability.
5. Set Portfolio Value and HODL Parameters
Enter how much capital you want to allocate in total (for the dynamic strategy) and adjust HODL buy quantities and thresholds as desired. (HODL Profit % is calculated from the Portfolio Value)
6. Inspect the Tables
On the chart, the script can display multiple tables showing your allocations, returns, risk metrics, and which assets are leading or lagging. Monitor these to make decisions about capital distribution or see how the strategy evolves.
------------------------------------------------------------------------
Additional Remarks
This script aims to simplify multi-asset portfolio management in a single tool. It emphasizes user-friendliness by color-coding the data in tables, so you do not need extra spreadsheets. The script is also flexible in letting you lock allocations or compare dynamic updates.
Always remember that no script can guarantee profitable outcomes. Real markets involve unpredictability, and real trading includes fees, slippage, and liquidity constraints not fully accounted for here. The script uses real-time and historical data for demonstration and educational purposes, providing a testing environment for various systematic strategies.
Performance Considerations
Due to the complexity of this script, users may experience longer loading times, especially when handling multiple assets or using advanced allocation methods. In some cases, calculations may time out if too many settings are adjusted simultaneously. If this occurs, removing and reapplying the indicator to the chart can help reset the process. Additionally, it is recommended to configure inputs gradually instead of adjusting all parameters at once, as excessive changes can extend the script’s loading duration beyond TradingView’s processing limits.
------------------------------------------------------------------------
Originality
This script stands out by integrating multiple asset management techniques within a single indicator, eliminating the need for multiple scripts or external portfolio tools. Unlike traditional single-asset strategies, it simultaneously evaluates multiple assets, applies systematic allocation logic, and tracks risk-adjusted performance in real time. The script is designed to function within TradingView’s script limitations while still allowing for complex portfolio simulations, making it an efficient tool for traders managing diverse holdings. Additionally, its combination of systematic trading signals with allocation-based diversification provides a structured approach to balancing exposure across different market conditions. The dynamic interplay between adaptive trading strategies and passive accumulation further differentiates it from conventional strategy indicators that focus solely on directional signals without considering capital allocation.
Conclusion
Uptrick: Portfolio Allocation Diversification pulls multiple assets into one efficient workflow, where each asset’s signal, volatility, and performance is measured, then assigned a share of capital according to your selected diversification method. The script accommodates both dynamic rebalancing and a locked allocation style, plus an ongoing HODL simulation for passive accumulation comparison. It neatly visualizes the entire process through on-chart tables that are updated every bar.
Traders and investors looking for ways to manage multiple assets under one unified framework can explore the different modules within this script to find what suits their style. Users can quickly switch among trading systems, vary the allocation approach, or review side-by-side performance metrics to see which method aligns best with their risk tolerance and market perspective.

Auto Fib Retracement with Buy/SellKey Features of the Advanced Script:
Multi-Timeframe (MTF) Analysis:
We added an input for the higher timeframe (higher_tf), where the trend is checked on a higher timeframe to confirm the primary trend direction.
Complex Trend Detection:
The trend is determined not only by the current timeframe but also by the trend on the higher timeframe, giving a more comprehensive and reliable signal.
Dynamic Fibonacci Levels:
Fibonacci lines are plotted dynamically, extending them based on price movement, with the Fibonacci retracement drawn only when a trend is identified.
Background Color & Labels:
A background color is added to give a clear indication of the trend direction. Green for uptrend, red for downtrend. It makes it visually easier to understand the current market structure.
"Buy" or "Sell" labels are shown directly on the chart to mark possible entry points.
Strategy and Backtesting:
The script includes strategy commands (strategy.entry and strategy.exit), which allow for backtesting the strategy in TradingView.
Stop loss and take profit conditions are added (loss=100, profit=200), which can be adjusted according to your preferences.
Next Steps:
Test with different timeframes: Try changing the higher_tf to different timeframes (like "60" or "240") and see how it affects the trend detection.
Adjust Fibonacci settings: Modify how the Fibonacci levels are calculated or add more Fibonacci levels like 38.2%, 61.8%, etc.
Optimize Strategy Parameters: Fine-tune the entry/exit logic by adjusting stop loss, take profit, and other strategy parameters.
This should give you a robust foundation for creating advanced trend detection strategies
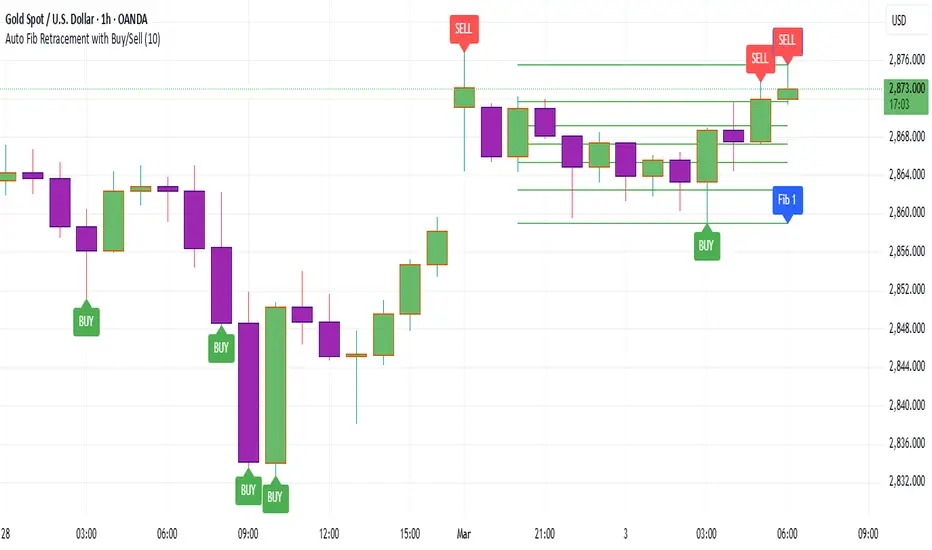
Silver Bullet ICT Strategy [TradingFinder] 10-11 AM NY Time +FVG🔵 Introduction
The ICT Silver Bullet trading strategy is a precise, time-based algorithmic approach that relies on Fair Value Gaps and Liquidity to identify high-probability trade setups. The strategy primarily focuses on the New York AM Session from 10:00 AM to 11:00 AM, leveraging heightened market activity within this critical window to capture short-term trading opportunities.
As an intraday strategy, it is most effective on lower timeframes, with ICT recommending a 15-minute chart or lower. While experienced traders often utilize 1-minute to 5-minute charts, beginners may find the 1-minute timeframe more manageable for applying this strategy.
This approach specifically targets quick trades, designed to take advantage of market movements within tight one-hour windows. By narrowing its focus, the Silver Bullet offers a streamlined and efficient method for traders to capitalize on liquidity shifts and price imbalances with precision.
In the fast-paced world of forex trading, the ability to identify market manipulation and false price movements is crucial for traders aiming to stay ahead of the curve. The Silver Bullet Indicator simplifies this process by integrating ICT principles such as liquidity traps, Order Blocks, and Fair Value Gaps (FVG).
These concepts form the foundation of a tool designed to mimic the strategies of institutional players, empowering traders to align their trades with the "smart money." By transforming complex market dynamics into actionable insights, the Silver Bullet Indicator provides a powerful framework for short-term trading success
Silver Bullet Bullish Setup :
Silver Bullet Bearish Setup :
🔵 How to Use
The Silver Bullet Indicator is a specialized tool that operates within the critical time windows of 9:00-10:00 and 10:00-11:00 in the forex market. Its design incorporates key principles from ICT (Inner Circle Trader) methodology, focusing on concepts such as liquidity traps, CISD Levels, Order Blocks, and Fair Value Gaps (FVG) to provide precise and actionable trade setups.
🟣 Bullish Setup
In a bullish setup, the indicator starts by marking the high and low of the session, serving as critical reference points for liquidity. A typical sequence involves a liquidity grab below the low, where the price manipulates retail traders into selling positions by breaching a key support level.
This movement is often orchestrated by smart money to accumulate buy orders. Following this liquidity grab, a market structure shift (MSS) occurs, signaled by the price breaking the CISD Level—a confirmation of bullish intent. The indicator then highlights an Order Block near the CISD Level, representing the zone where institutional buying is concentrated.
Additionally, it identifies a Fair Value Gap, which acts as a high-probability area for price retracement and trade entry. Traders can confidently take long positions when the price revisits these zones, targeting the next significant liquidity pool or resistance level.
Bullish Setup in CAPITALCOM:US100 :
🟣 Bearish Setup
Conversely, in a bearish setup, the price manipulates liquidity by creating a false breakout above the high of the session. This move entices retail traders into long positions, allowing institutional players to enter sell orders.
Once the price reverses direction and breaches the CISD Level to the downside, a change of character (CHOCH) becomes evident, confirming a bearish market structure. The indicator highlights an Order Block near this level, indicating the origin of the institutional sell orders, along with an associated FVG, which represents an imbalance zone likely to be revisited before the price continues downward.
By entering short positions when the price retraces to these levels, traders align their strategies with the anticipated continuation of bearish momentum, targeting nearby liquidity voids or support zones.
Bearish Setup in OANDA:XAUUSD :
🔵 Settings
Refine Order Block : Enables finer adjustments to Order Block levels for more accurate price responses.
Mitigation Level OB : Allows users to set specific reaction points within an Order Block, including: Proximal: Closest level to the current price. 50% OB: Midpoint of the Order Block. Distal: Farthest level from the current price.
FVG Filter : The Judas Swing indicator includes a filter for Fair Value Gap (FVG), allowing different filtering based on FVG width: FVG Filter Type: Can be set to "Very Aggressive," "Aggressive," "Defensive," or "Very Defensive." Higher defensiveness narrows the FVG width, focusing on narrower gaps.
Mitigation Level FVG : Like the Order Block, you can set price reaction levels for FVG with options such as Proximal, 50% OB, and Distal.
CISD : The Bar Back Check option enables traders to specify the number of past candles checked for identifying the CISD Level, enhancing CISD Level accuracy on the chart.
🔵 Conclusion
The Silver Bullet Indicator is a cutting-edge tool designed specifically for forex traders who aim to leverage market dynamics during critical liquidity windows. By focusing on the highly active 9:00-10:00 and 10:00-11:00 timeframes, the indicator simplifies complex market concepts such as liquidity traps, Order Blocks, Fair Value Gaps (FVG), and CISD Levels, transforming them into actionable insights.
What sets the Silver Bullet Indicator apart is its precision in detecting false breakouts and market structure shifts (MSS), enabling traders to align their strategies with institutional activity. The visual clarity of its signals, including color-coded zones and directional arrows, ensures that both novice and experienced traders can easily interpret and apply its findings in real-time.
By integrating ICT principles, the indicator empowers traders to identify high-probability entry and exit points, minimize risk, and optimize trade execution. Whether you are capturing short-term price movements or navigating complex market conditions, the Silver Bullet Indicator offers a robust framework to enhance your trading performance.
Ultimately, this tool is more than just an indicator; it is a strategic ally for traders who seek to decode the movements of smart money and capitalize on institutional strategies. With the Silver Bullet Indicator, traders can approach the market with greater confidence, precision, and profitability.

Bitcoin Destiny Line Model v1.1The Bitcoin Destiny Line Model
Table of Contents
1. Overview
2. Analytical and Technical Techniques Employed
3. Objectives of the Bitcoin Destiny Line Model
4. Key Technical Components and Functionalities
4.1. Bitcoin Destiny Line and Heatmap
4.2. Halving Cycles Markers
4.3. Dynamic Repricing Rails with Diminishing Volatility Adjustment
4.4. Seasonal Dynamics
4.5. Support and Resistance Zones
4.6. Market Action Indicators
4.7. Cycle Projections
4.8. Heatmap Only
5. Settings
6. Different Strategies to Utilize the Model
6.1. Value-Based Entry Strategy
6.2. Long-Term Position Strategy
6.3. Scaling Out Strategy
6.4. Portfolio Rebalancing Strategy
6.5. Bear Market Strategy
6.6. Short-Term Trading Strategy
7. Recommendations and Disclosures
1. Overview
The Bitcoin Destiny Line Model is a technical analysis toolset designed exclusively for Bitcoin. It integrates a comprehensive suite of analytical methodologies to provide deep insights into Bitcoin's market dynamics focusing on long-term investment strategies.
By analyzing historical data through various technical frameworks, the model helps investors gain insight into the current market structure, cycle dynamics, direction, and trend of Bitcoin, assisting investors and traders with data-driven decision-making.
2. Analytical and Technical Techniques Employed
The model integrates a range of analytical techniques:
Cycle Analysis - Centers on the Bitcoin halving event to anticipate phases within the Bitcoin cycle.
Logarithmic Regression Analysis - Calculates the logarithmic growth of Bitcoin over time.
Standard Deviation - Measures how significantly the price action differs from the long-term logarithmic trend.
Fibonacci Analysis - Identifies support and resistance levels.
Multi-Timeframe Momentum - Analyzes overbought or oversold conditions across multiple periods.
Trendlines - Draws trendlines from expected cycle lows to expected cycle highs extending logarithmic and deviation lines into the future as projection lines.
3. Objectives of the Bitcoin Destiny Line Model
The model is crafted to deliver an empirical framework for Bitcoin investing:
Bitcoin Market Structure - Offers insights into Bitcoin’s market structure.
Identify Value Opportunities and Risk Areas - Pinpoints potential value-entry opportunities and recognizes when the market is over-extended.
Leverage Market Cycles - Utilizes knowledge of Bitcoin’s seasonal dynamics and halving cycles to inform investment strategies.
Mitigate Downside Risk - Provides indicators for potential market corrections, aiding in risk management and avoidance of buying at peak prices.
4. Key Technical Components and Functionalities
4.1. Bitcoin Destiny Line and Heatmap
The cycle low to cycle high line with a risk-based color-coded heatmap serves as a central reference for Bitcoin’s price trajectory.
It emphasizes the long-term trend indicating areas of value in cool colors and areas of risk in warm colors.
4.2. Halving Cycles Markers
Bitcoin halving events are marked on the chart with vertical lines forming anchor points for cycle analysis.
4.3. Dynamic Repricing Rails with Diminishing Volatility Adjustment
Repricing rails based on the long-term logarithmic trend highlight the rails on which Bitcoin's price will reprice up or down.
Adjusts to the diminishing volatility of the asset over time as it matures.
4.4. Seasonal Dynamics
Integrates Bitcoin's inherent seasonal trends to provide additional context for market conditions aligning with broader market analysis.
Understanding Bitcoin’s seasons:
Spring Awakening - The initial recovery phase where the market begins to rebound from a bear market showing early signs of improvement. This is an ideal time for cautious optimism. Investors should consider gradually increasing their positions in Bitcoin, focusing on accumulation as confidence in market recovery grows.
Blossom Boom - A market bottom has been confirmed by now and market interest continues to pick up ahead of the Bitcoin halving. This typically presents a great opportunity for investors to position themselves advantageously ahead of expected price movements. It’s a good time to review and adjust portfolios to align with anticipated trends.
Midsummer Momentum - This phase follows the Bitcoin halving, characterized by a sideways to upward price trend often supported by heightened interest and media coverage. It represents potentially the last opportunity in the cycle for investors to purchase Bitcoin at lower price levels unlikely to be seen again. Investors should closely monitor the market for value buying opportunities to bolster their long-term investment strategies.
Rocket Rise - A phase where Bitcoin prices are likely to surge dramatically driven by a mix of Fear of Missing Out (FOMO) among new investors and widespread media hype. The strategy here is twofold: long-term holders should hold steady to reap maximum gains whereas more speculative investors might look to capitalize on the volatility by taking profits at optimal moments before a potential correction.
Winter Whispers - Following a bull run, the market begins to cool, marked by some investors taking profits and consequently increasing price fluctuations and volatility. During this time, investors should remain vigilant, tightening stop-loss orders to safeguard gains. This phase may be suitable for those looking to liquidate a portion of their long-term investments. However, for an investor to be selling the majority of their Bitcoin holdings is generally not advisable as it could preclude benefiting from potential future appreciations.
Deep Freeze - The market enters a bearish phase with significant price declines and market corrections. It's a period of consolidation and resetting of price levels. The end of this stage could typically be seen as a buying opportunity for the long-term investor. Accumulating Bitcoin during this phase can be advantageous as prices are lower and provide a foundation for significant growth in the next cycle.
4.5. Support and Resistance Zones
Calculates key levels that inform stop-loss placements and trading size decisions enhancing trading strategy around the Bitcoin Destiny Line.
4.6. Market Action Indicators
Suggests potential trading actions for different market phases aiding traders in identifying investment/trading opportunities.
Risk Indicator - Signals when prices are extremely over-extended helping to avoid entries during potential peak valuations.
4.7. Cycle Projections
Extends repricing levels into the future providing a visual forecast of expected price movements and enhancing strategic planning capabilities.
Cycle-High Price Projection Range - Provides a probabilistic range for upcoming cycle peaks based on historical trends and current market analysis.
4.8. Heatmap Only
It is also possible to plot the heatmap only as a background or as a bar in a second indicator.
4.9. Complete Visual View
A complete view of all key elements switched on the model.
5. Settings
Users can select to only show specific elements or all elements of the model.
They can set the sensitivity of some of the model elements and adjust certain view settings.
6. Different Strategies to Utilize the Model
The following strategies are enabled by the Bitcoin Destiny Line model:
6.1. Value-Based Entry Strategy
Investors can optimize their investment strategy by deploying investable cash either as a lump sum or on a dollar-cost averaging basis upon the display of a value indicator (Up-Triangles) which signals the highest probability for value entries.
6.2. Long-Term Position Strategy
As an alternative, investors may prefer to continue deploying investable funds while cooler colors (green or blue) are displayed on the value map, indicating favorable conditions for long-term positions.
6.3. Scaling Out Strategy
Investors may choose to scale out some of their investment upon the display of a risk indicator (circles) reducing exposure to potential downturns.
6.4. Portfolio Rebalancing Strategy
A sound strategy can also be to follow a portfolio rebalancing approach by deploying available investable cash upon the display of a value indicator. Rebalance the portfolio to maintain 25% in cash upon the display of a risk indicator. Adjust this ratio as subsequent risk indicators are triggered, deploying available cash upon future value signals.
6.5. Bear Market Strategy
In a bear market, traders may seek short positions upon the display of the Continued Downward Momentum indicator (Down Triangles) capitalizing on declining market trends.
6.6. Short-Term Trading Strategy
Traders can use hourly or 4-hourly data along with the daily Price Rails and Heatmap Bar for short-term positions. They may incorporate other preferred indicators such as RSI for entry/exit decisions.
7. Recommendations and Disclosures
Investors are recommended to take a prudent approach. It is not recommended for investors to scale out completely or significantly reduce the largest portion of their long-term Bitcoin positions in hopes of buying back at lower prices unless they have a compelling reason to do so. The future market conditions may not replicate past opportunities making this strategy uncertain. However, scaling out a smaller portion such as 25% can offer a high potential for an asymmetric risk-reward ratio. This approach is likely to provide a higher risk-adjusted return compared to traditional dollar-cost averaging or random lump sum adjustments.
The Bitcoin Destiny Line Model leverages 13.5 years of available price data across four complete Bitcoin market cycles.
While each additional cycle enriches the model's robustness and enhances the reliability of its forecasts, it is crucial for users to understand that historical trends are indicative of probable future directions and potential price ranges. Users should be cognizant that past performance is not a definitive predictor of future results and should not be the sole basis for investment decisions.

Stochastic / Connectable [Azullian]Advance your market analysis with the Stochastic Oscillator. Identify potential price reversals with precision, aiding in the creation of flexible and accurate strategies.
This connectable Stochastic indicator is part of an indicator system designed to help test, visualize and build strategy configurations without coding. Like all connectable indicators , it interacts through the TradingView input source, which serves as a signal connector to link indicators to each other. All connectable indicators send signal weight to the next node in the system until it reaches either a connectable signal monitor, signal filter and/or strategy.
█ UNIFORM SETTINGS AND A WAY OF WORK
Although connectable indicators may have specific weight scoring conditions, they all aim to follow a standardized general approach to weight scoring settings, as outlined below.
■ Connectable indicators - Settings
• 🗲 Energy: Energy applies an ATR multiplier to the plotted shapes on the chart. A higher value plots shapes farther away from the candle, enhancing visibility.
• ☼ Brightness: Brightness determines the opacity of the shape plotted on the chart, aiding visibility. Indicator weight also influences opacity.
• → Input: Use the input setting to specify a data source for the indicator. Here you can connect the indicator to other indicators.
• ⌥ Flow: Determine where you want to receive signals from:
○ Both: Weights from this indicator and the connected indicator will apply
○ Indicator only: Only weights from this indicator will apply
○ Input only: Only weights from the connected indicator will apply
• ⥅ Weight multiplier: Multiply all weights in the entire indicator by a given factor, useful for quickly testing different indicators in a granular setup.
• ⥇ Threshold: Set a threshold to indicate the minimum amount of weight it should receive to pass it through to the next indicator.
• ⥱ Limiter: Set a hard limit to the maximum amount of weight that can be fed through the indicator.
■ Connectable indicators - Weight scoring settings
▢ Weight scoring conditions
• SM – Signal mode: Enable specific conditions for weight scoring
○ All: All signals will be scored.
○ Entries only: Only entries will score.
○ Exits only: Only exits will score.
○ Entries & exits: Both entries and exits will score.
○ Zone: Continuous scoring for each candle within the zone.
• SP – Signal period: Defines a range of candles within which a signal can score.
• SC - Signal count: Specifies the number of bars to retrospectively examine and score.
○ Single: Score for a single occurrence
○ All occurrences: Score for all occurrences
○ Single + Threshold: Score for single occurrences within the signal period (SP)
○ Every + Threshold: Score for all occurrences within the signal period (SP)
▢ Weight scoring direction
• ES: Enter Short weight
• XL: Exit long weight
• EL: Enter Long weight
• XS: Exit Short weight
▢ Weight scoring values
• Weights can hold either positive or negative scores. Positive weights enhance a particular trading direction, while negative weights diminish it.
█ STOCHASTIC - INDICATOR SETTINGS
■ Main settings
• Enable/Disable Indicator: Toggle the entire indicator on or off.
• S - Source: Choose an alternative data source for the Stochastic calculation.
• T - Timeframe: Select an alternative timeframe for the Stochastic calculation.
• KL - %K Length: Define the number of bars or periods used in the calculation of the %K value.
• OB - Overbought Level: Determine the Stochastic value at which overbought conditions are met.
• OS - Oversold Level: Specify the Stochastic value at which oversold conditions are met.
• %K - %K Smoothing: DDefine the number of bars or periods used to smooth the %K value.
• %D - %D Smoothing: Define the number of bars or periods used to calculate and smooth the %D
■ Scoring functionality
• The Stochastic scores long entries when the %K line crosses above the %D line within the OS (oversold) area.
• The Stochastic scores long exits when the %K line crosses below the %D line after being in the OS (oversold) area.
• The Stochastic scores long zones for the duration the %K is above the %D line within the OS (oversold) area.
• The Stochastic scores short entries when the %K line crosses below the %D line within the OB (overbought) area.
• The Stochastic scores short exits when the %K line crosses above the %D line after being in the OB (overbought) area.
• The Stochastic scores short zones for the duration the %K is below the %D line within the OB (overbought) area.
█ PLOTTING
• Standard: Symbols (EL, XS, ES, XL) appear relative to candles based on set conditions. Their opacity and position vary with weight.
• Conditional Settings: A larger icon appears if global conditions are met. For instance, with a Threshold(⥇) of 12, Signal Period (SP) of 3, and Scoring Condition (SC) set to "EVERY", a Stochastic signaling over two times in 3 candles (scoring 6 each) triggers a larger icon.
█ USAGE OF CONNECTABLE INDICATORS
■ Connectable chaining mechanism
Connectable indicators can be connected directly to the signal monitor, signal filter or strategy , or they can be daisy chained to each other while the last indicator in the chain connects to the signal monitor, signal filter or strategy. When using a signal filter you can chain the filter to the strategy input to make your chain complete.
• Direct chaining: Connect an indicator directly to the signal monitor, signal filter or strategy through the provided inputs (→).
• Daisy chaining: Connect indicators using the indicator input (→). The first in a daisy chain should have a flow (⌥) set to 'Indicator only'. Subsequent indicators use 'Both' to pass the previous weight. The final indicator connects to the signal monitor, signal filter, or strategy.
■ Set up this indicator with a signal filter and strategy
The indicator provides visual cues based on signal conditions. However, its weight system is best utilized when paired with a connectable signal filter, signal monitor, or strategy .
Let's connect the Stochastic to a connectable signal filter and a strategy :
1. Load all relevant indicators
• Load Stochastic / Connectable
• Load Signal filter / Connectable
• Load Strategy / Connectable
2. Signal Filter: Connect the Stochastic to the Signal Filter
• Open the signal filter settings
• Choose one of the three input dropdowns (1→, 2→, 3→) and choose : Stochastic / Connectable: Signal Connector
• Toggle the enable box before the connected input to enable the incoming signal
3. Signal Filter: Update the filter signals settings if needed
• The default settings of the filter enable EL (Enter Long), XL (Exit Long), ES (Enter Short) and XS (Exit Short).
4. Signal Filter: Update the weight threshold settings if needed
• All connectable indicators load by default with a score of 6 for each direction (EL, XL, ES, XS)
• By default, weight threshold (TH) is set at 5. This allows each occurrence to score, as the default score in each connectable indicator is 1 point above the threshold. Adjust to your liking.
5. Strategy: Connect the strategy to the signal filter in the strategy settings
• Select a strategy input → and select the Signal filter: Signal connector
6. Strategy: Enable filter compatible directions
• Set the signal mode of the strategy to a compatible direction with the signal filter.
Now that everything is connected, you'll notice green spikes in the signal filter representing long signals, and red spikes indicating short signals. Trades will also appear on the chart, complemented by a performance overview. Your journey is just beginning: delve into different scoring mechanisms, merge diverse connectable indicators, and craft unique chains. Instantly test your results and discover the potential of your configurations. Dive deep and enjoy the process!
█ BENEFITS
• Adaptable Modular Design: Arrange indicators in diverse structures via direct or daisy chaining, allowing tailored configurations to align with your analysis approach.
• Streamlined Backtesting: Simplify the iterative process of testing and adjusting combinations, facilitating a smoother exploration of potential setups.
• Intuitive Interface: Navigate TradingView with added ease. Integrate desired indicators, adjust settings, and establish alerts without delving into complex code.
• Signal Weight Precision: Leverage granular weight allocation among signals, offering a deeper layer of customization in strategy formulation.
• Advanced Signal Filtering: Define entry and exit conditions with more clarity, granting an added layer of strategy precision.
• Clear Visual Feedback: Distinct visual signals and cues enhance the readability of charts, promoting informed decision-making.
• Standardized Defaults: Indicators are equipped with universally recognized preset settings, ensuring consistency in initial setups across different types like momentum or volatility.
• Reliability: Our indicators are meticulously developed to prevent repainting. We strictly adhere to TradingView's coding conventions, ensuring our code is both performant and clean.
█ COMPATIBLE INDICATORS
Each indicator that incorporates our open-source 'azLibConnector' library and adheres to our conventions can be effortlessly integrated and used as detailed above.
For clarity and recognition within the TradingView platform, we append the suffix ' / Connectable' to every compatible indicator.
█ COMMON MISTAKES, CLARIFICATIONS AND TIPS
• Removing an indicator from a chain: Deleting a linked indicator and confirming the "remove study tree" alert will also remove all underlying indicators in the object tree. Before removing one, disconnect the adjacent indicators and move it to the object stack's bottom.
• Point systems: The azLibConnector provides 500 points for each direction (EL: Enter long, XL: Exit long, ES: Enter short, XS: Exit short) Remember this cap when devising a point structure.
• Flow misconfiguration: In daisy chains the first indicator should always have a flow (⌥) setting of 'indicator only' while other indicator should have a flow (⌥) setting of 'both'.
• Hide attributes: As connectable indicators send through quite some information you'll notice all the arguments are taking up some screenwidth and cause some visual clutter. You can disable arguments in Chart Settings / Status line.
• Layout and abbreviations: To maintain a consistent structure, we use abbreviations for each input. While this may initially seem complex, you'll quickly become familiar with them. Each abbreviation is also explained in the inline tooltips.
• Inputs: Connecting a connectable indicator directly to the strategy delivers the raw signal without a weight threshold, meaning every signal will trigger a trade.
█ A NOTE OF GRATITUDE
Through years of exploring TradingView and Pine Script, we've drawn immense inspiration from the community's knowledge and innovation. Thank you for being a constant source of motivation and insight.
█ RISK DISCLAIMER
Azullian's content, tools, scripts, articles, and educational offerings are presented purely for educational and informational uses. Please be aware that past performance should not be considered a predictor of future results.
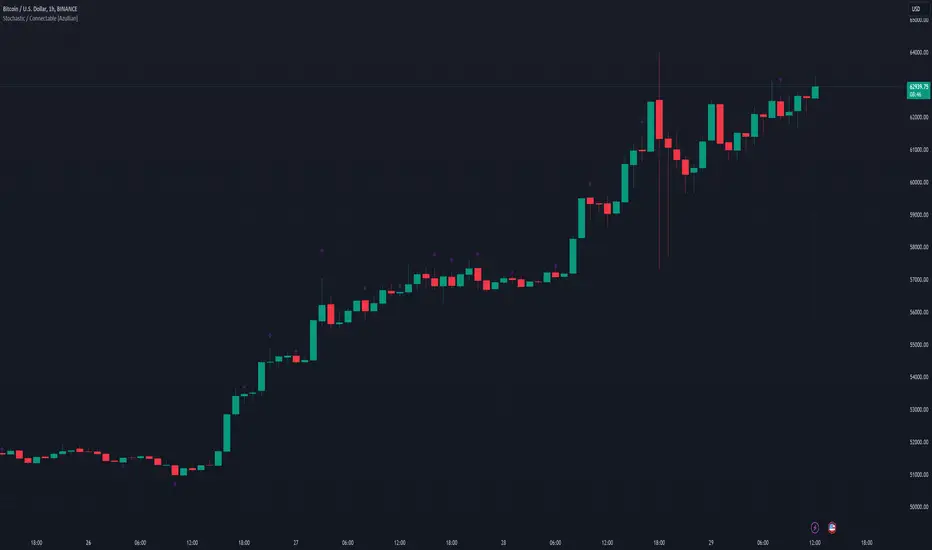
MACD / Connectable [Azullian]Enhance your market insight with the MACD indicator. Monitor momentum to make more informed trading decisions, facilitating the development of stronger strategies.
This connectable MACD indicator is part of an indicator system designed to help test, visualize and build strategy configurations without coding. Like all connectable indicators , it interacts through the TradingView input source, which serves as a signal connector to link indicators to each other. All connectable indicators send signal weight to the next node in the system until it reaches either a connectable signal monitor, signal filter and/or strategy.
█ UNIFORM SETTINGS AND A WAY OF WORK
Although connectable indicators may have specific weight scoring conditions, they all aim to follow a standardized general approach to weight scoring settings, as outlined below.
■ Connectable indicators - Settings
• 🗲 Energy: Energy applies an ATR multiplier to the plotted shapes on the chart. A higher value plots shapes farther away from the candle, enhancing visibility.
• ☼ Brightness: Brightness determines the opacity of the shape plotted on the chart, aiding visibility. Indicator weight also influences opacity.
• → Input: Use the input setting to specify a data source for the indicator. Here you can connect the indicator to other indicators.
• ⌥ Flow: Determine where you want to receive signals from:
○ Both: Weights from this indicator and the connected indicator will apply
○ Indicator only: Only weights from this indicator will apply
○ Input only: Only weights from the connected indicator will apply
• ⥅ Weight multiplier: Multiply all weights in the entire indicator by a given factor, useful for quickly testing different indicators in a granular setup.
• ⥇ Threshold: Set a threshold to indicate the minimum amount of weight it should receive to pass it through to the next indicator.
• ⥱ Limiter: Set a hard limit to the maximum amount of weight that can be fed through the indicator.
■ Connectable indicators - Weight scoring settings
▢ Weight scoring conditions
• SM – Signal mode: Enable specific conditions for weight scoring
○ All: All signals will be scored.
○ Entries only: Only entries will score.
○ Exits only: Only exits will score.
○ Entries & exits: Both entries and exits will score.
○ Zone: Continuous scoring for each candle within the zone.
• SP – Signal period: Defines a range of candles within which a signal can score.
• SC - Signal count: Specifies the number of bars to retrospectively examine and score.
○ Single: Score for a single occurrence
○ All occurrences: Score for all occurrences
○ Single + Threshold: Score for single occurrences within the signal period (SP)
○ Every + Threshold: Score for all occurrences within the signal period (SP)
▢ Weight scoring direction
• ES: Enter Short weight
• XL: Exit long weight
• EL: Enter Long weight
• XS: Exit Short weight
▢ Weight scoring values
• Weights can hold either positive or negative scores. Positive weights enhance a particular trading direction, while negative weights diminish it.
█ MACD - INDICATOR SETTINGS
■ Main settings
• Enable/Disable Indicator: Toggle the entire indicator on or off.
• S - Source: Choose an alternative data source for the MACD calculation.
• T - Timeframe: Select an alternative timeframe for the MACD calculation.
• FL - Fast Length: Define the number of bars or periods used in the MACD calculation for the fast length.
• SL - Fast Length: Define the number of bars or periods used in the MACD calculation for the slow length.
• SM - Smoothing: Smooths the averaged MACD over a specified period.
• C - Condition Define the smoothing amount
○ Above/Below zero: : Trigger when the MACD line is above or below zero
○ All: : Trigger on all conditions
■ MACD Scoring functionality
• The MACD scores long entries when it crosses above its smoothed value and is below the zero line.
• The MACD scores long exits when it crosses below its smoothed value after a long entry.
• The MACD scores long zones the entire time the MACD line is above its smoothed value and below zero.
• The MACD scores short entries when it crosses below its smoothed value and is above the zero line.
• The MACD scores short exits when it crosses above its smoothed value after a short entry.
• The MACD scores short zones the entire time the MACD line is below its smoothed value and above zero.
█ PLOTTING
• Standard: Symbols (EL, XS, ES, XL) appear relative to candles based on set conditions. Their opacity and position vary with weight.
• Conditional Settings: A larger icon appears if global conditions are met. For instance, with a Threshold(⥇) of 12, Signal Period (SP) of 3, and Scoring Condition (SC) set to "EVERY", an MACD signaling over two times in 3 candles (scoring 6 each) triggers a larger icon.
█ USAGE OF CONNECTABLE INDICATORS
■ Connectable chaining mechanism
Connectable indicators can be connected directly to the signal monitor, signal filter or strategy , or they can be daisy chained to each other while the last indicator in the chain connects to the signal monitor, signal filter or strategy. When using a signal filter you can chain the filter to the strategy input to make your chain complete.
• Direct chaining: Connect an indicator directly to the signal monitor, signal filter or strategy through the provided inputs (→).
• Daisy chaining: Connect indicators using the indicator input (→). The first in a daisy chain should have a flow (⌥) set to 'Indicator only'. Subsequent indicators use 'Both' to pass the previous weight. The final indicator connects to the signal monitor, signal filter, or strategy.
■ Set up this indicator with a signal filter and strategy
The indicator provides visual cues based on signal conditions. However, its weight system is best utilized when paired with a connectable signal filter, monitor, or strategy .
Let's connect the MACD to a connectable signal filter and a strategy :
1. Load all relevant indicators
• Load MACD / Connectable
• Load Signal filter / Connectable
• Load Strategy / Connectable
2. Signal Filter: Connect the MACD to the Signal Filter
• Open the signal filter settings
• Choose one of the three input dropdowns (1→, 2→, 3→) and choose : MACD / Connectable: Signal Connector
• Toggle the enable box before the connected input to enable the incoming signal
3. Signal Filter: Update the filter signals settings if needed
• The default settings of the filter enable EL (Enter Long), XL (Exit Long), ES (Enter Short) and XS (Exit Short).
4. Signal Filter: Update the weight threshold settings if needed
• All connectable indicators load by default with a score of 6 for each direction (EL, XL, ES, XS)
• By default, weight threshold (TH) is set at 5. This allows each occurrence to score, as the default score in each connectable indicator is 1 point above the threshold. Adjust to your liking.
5. Strategy: Connect the strategy to the signal filter in the strategy settings
• Select a strategy input → and select the Signal filter: Signal connector
6. Strategy: Enable filter compatible directions
• Set the signal mode of the strategy to a compatible direction with the signal filter.
Now that everything is connected, you'll notice green spikes in the signal filter representing long signals, and red spikes indicating short signals. Trades will also appear on the chart, complemented by a performance overview. Your journey is just beginning: delve into different scoring mechanisms, merge diverse connectable indicators, and craft unique chains. Instantly test your results and discover the potential of your configurations. Dive deep and enjoy the process!
█ BENEFITS
• Adaptable Modular Design: Arrange indicators in diverse structures via direct or daisy chaining, allowing tailored configurations to align with your analysis approach.
• Streamlined Backtesting: Simplify the iterative process of testing and adjusting combinations, facilitating a smoother exploration of potential setups.
• Intuitive Interface: Navigate TradingView with added ease. Integrate desired indicators, adjust settings, and establish alerts without delving into complex code.
• Signal Weight Precision: Leverage granular weight allocation among signals, offering a deeper layer of customization in strategy formulation.
• Advanced Signal Filtering: Define entry and exit conditions with more clarity, granting an added layer of strategy precision.
• Clear Visual Feedback: Distinct visual signals and cues enhance the readability of charts, promoting informed decision-making.
• Standardized Defaults: Indicators are equipped with universally recognized preset settings, ensuring consistency in initial setups across different types like momentum or volatility.
• Reliability: Our indicators are meticulously developed to prevent repainting. We strictly adhere to TradingView's coding conventions, ensuring our code is both performant and clean.
█ COMPATIBLE INDICATORS
Each indicator that incorporates our open-source 'azLibConnector' library and adheres to our conventions can be effortlessly integrated and used as detailed above.
For clarity and recognition within the TradingView platform, we append the suffix ' / Connectable' to every compatible indicator.
█ COMMON MISTAKES, CLARIFICATIONS AND TIPS
• Removing an indicator from a chain: Deleting a linked indicator and confirming the "remove study tree" alert will also remove all underlying indicators in the object tree. Before removing one, disconnect the adjacent indicators and move it to the object stack's bottom.
• Point systems: The azLibConnector provides 500 points for each direction (EL: Enter long, XL: Exit long, ES: Enter short, XS: Exit short) Remember this cap when devising a point structure.
• Flow misconfiguration: In daisy chains the first indicator should always have a flow (⌥) setting of 'indicator only' while other indicator should have a flow (⌥) setting of 'both'.
• Hide attributes: As connectable indicators send through quite some information you'll notice all the arguments are taking up some screenwidth and cause some visual clutter. You can disable arguments in Chart Settings / Status line.
• Layout and abbreviations: To maintain a consistent structure, we use abbreviations for each input. While this may initially seem complex, you'll quickly become familiar with them. Each abbreviation is also explained in the inline tooltips.
• Inputs: Connecting a connectable indicator directly to the strategy delivers the raw signal without a weight threshold, meaning every signal will trigger a trade.
█ A NOTE OF GRATITUDE
Through years of exploring TradingView and Pine Script, we've drawn immense inspiration from the community's knowledge and innovation. Thank you for being a constant source of motivation and insight.
█ RISK DISCLAIMER
Azullian's content, tools, scripts, articles, and educational offerings are presented purely for educational and informational uses. Please be aware that past performance should not be considered a predictor of future results.

CCI / Connectable [Azullian]Sharpen your analysis of market trends with the CCI indicator. Effectively evaluate market cycles and identify potential reversals, enriching your strategic planning.
This connectable CCI indicator is part of an indicator system designed to help test, visualize and build strategy configurations without coding. Like all connectable indicators , it interacts through the TradingView input source, which serves as a signal connector to link indicators to each other. All connectable indicators send signal weight to the next node in the system until it reaches either a connectable signal monitor, signal filter and/or strategy.
█ UNIFORM SETTINGS AND A WAY OF WORK
Although connectable indicators may have specific weight scoring conditions, they all aim to follow a standardized general approach to weight scoring settings, as outlined below.
■ Connectable indicators - Settings
• 🗲 Energy: Energy applies an ATR multiplier to the plotted shapes on the chart. A higher value plots shapes farther away from the candle, enhancing visibility.
• ☼ Brightness: Brightness determines the opacity of the shape plotted on the chart, aiding visibility. Indicator weight also influences opacity.
• → Input: Use the input setting to specify a data source for the indicator. Here you can connect the indicator to other indicators.
• ⌥ Flow: Determine where you want to receive signals from:
○ Both: Weights from this indicator and the connected indicator will apply
○ Indicator only: Only weights from this indicator will apply
○ Input only: Only weights from the connected indicator will apply
• ⥅ Weight multiplier: Multiply all weights in the entire indicator by a given factor, useful for quickly testing different indicators in a granular setup.
• ⥇ Threshold: Set a threshold to indicate the minimum amount of weight it should receive to pass it through to the next indicator.
• ⥱ Limiter: Set a hard limit to the maximum amount of weight that can be fed through the indicator.
■ Connectable indicators - Weight scoring settings
▢ Weight scoring conditions
• SM – Signal mode: Enable specific conditions for weight scoring
○ All: All signals will be scored.
○ Entries only: Only entries will score.
○ Exits only: Only exits will score.
○ Entries & exits: Both entries and exits will score.
○ Zone: Continuous scoring for each candle within the zone.
• SP – Signal period: Defines a range of candles within which a signal can score.
• SC - Signal count: Specifies the number of bars to retrospectively examine and score.
○ Single: Score for a single occurrence
○ All occurrences: Score for all occurrences
○ Single + Threshold: Score for single occurrences within the signal period (SP)
○ Every + Threshold: Score for all occurrences within the signal period (SP)
▢ Weight scoring direction
• ES: Enter Short weight
• XL: Exit long weight
• EL: Enter Long weight
• XS: Exit Short weight
▢ Weight scoring values
• Weights can hold either positive or negative scores. Positive weights enhance a particular trading direction, while negative weights diminish it.
█ CCI - INDICATOR SETTINGS
■ Main settings
• Enable/Disable Indicator: Toggle the entire indicator on or off.
• S - Source: Choose an alternative data source for the CCI calculation.
• T - Timeframe: Select an alternative timeframe for the CCI calculation.
• LE - Length: Define the number of bars or periods used in the CCI calculation.
• OB - Overbought Level: Determine the CCI value at which overbought conditions are met.
• OS - Oversold Level: Specify the CCI value at which oversold conditions are met.
■ Scoring functionality
• The CCI scores long entries when the CCI enters OS: oversold area
• The CCI scores long exits when the CCI exits OS: oversold area
• The CCI scores long zones the entire time the CCI is in OS: oversold area
• The CCI scores short entries when the CCI enters OB: overbought area
• The CCI scores short exits when the CCI exits OB: overbought area
• The CCI scores short zones the entire time the CCI is in OB: overbought area
█ PLOTTING
• Standard: Symbols (EL, XS, ES, XL) appear relative to candles based on set conditions. Their opacity and position vary with weight.
• Conditional Settings: A larger icon appears if global conditions are met. For instance, with a Threshold(⥇) of 12, Signal Period (SP) of 3, and Scoring Condition (SC) set to "EVERY", an CCI signaling over two times in 3 candles (scoring 6 each) triggers a larger icon.
█ USAGE OF CONNECTABLE INDICATORS
■ Connectable chaining mechanism
Connectable indicators can be connected directly to the signal monitor, signal filter or strategy , or they can be daisy chained to each other while the last indicator in the chain connects to the signal monitor, signal filter or strategy. When using a signal filter you can chain the filter to the strategy input to make your chain complete.
• Direct chaining: Connect an indicator directly to the signal monitor, signal filter or strategy through the provided inputs (→).
• Daisy chaining: Connect indicators using the indicator input (→). The first in a daisy chain should have a flow (⌥) set to 'Indicator only'. Subsequent indicators use 'Both' to pass the previous weight. The final indicator connects to the signal monitor, signal filter, or strategy.
■ Set up this indicator with a signal filter and strategy
The indicator provides visual cues based on signal conditions. However, its weight system is best utilized when paired with a connectable signal filter, monitor, or strategy .
Let's connect the CCI to a connectable signal filter and a strategy :
1. Load all relevant indicators
• Load CCI / Connectable
• Load Signal filter / Connectable
• Load Strategy / Connectable
2. Signal Filter: Connect the CCI to the Signal Filter
• Open the signal filter settings
• Choose one of the three input dropdowns (1→, 2→, 3→) and choose : CCI / Connectable: Signal Connector
• Toggle the enable box before the connected input to enable the incoming signal
3. Signal Filter: Update the filter signals settings if needed
• The default settings of the filter enable EL (Enter Long), XL (Exit Long), ES (Enter Short) and XS (Exit Short).
4. Signal Filter: Update the weight threshold settings if needed
• All connectable indicators load by default with a score of 6 for each direction (EL, XL, ES, XS)
• By default, weight threshold (TH) is set at 5. This allows each occurrence to score, as the default score in each connectable indicator is 1 point above the threshold. Adjust to your liking.
5. Strategy: Connect the strategy to the signal filter in the strategy settings
• Select a strategy input → and select the Signal filter: Signal connector
6. Strategy: Enable filter compatible directions
• Set the signal mode of the strategy to a compatible direction with the signal filter.
Now that everything is connected, you'll notice green spikes in the signal filter representing long signals, and red spikes indicating short signals. Trades will also appear on the chart, complemented by a performance overview. Your journey is just beginning: delve into different scoring mechanisms, merge diverse connectable indicators, and craft unique chains. Instantly test your results and discover the potential of your configurations. Dive deep and enjoy the process!
█ BENEFITS
• Adaptable Modular Design: Arrange indicators in diverse structures via direct or daisy chaining, allowing tailored configurations to align with your analysis approach.
• Streamlined Backtesting: Simplify the iterative process of testing and adjusting combinations, facilitating a smoother exploration of potential setups.
• Intuitive Interface: Navigate TradingView with added ease. Integrate desired indicators, adjust settings, and establish alerts without delving into complex code.
• Signal Weight Precision: Leverage granular weight allocation among signals, offering a deeper layer of customization in strategy formulation.
• Advanced Signal Filtering: Define entry and exit conditions with more clarity, granting an added layer of strategy precision.
• Clear Visual Feedback: Distinct visual signals and cues enhance the readability of charts, promoting informed decision-making.
• Standardized Defaults: Indicators are equipped with universally recognized preset settings, ensuring consistency in initial setups across different types like momentum or volatility.
• Reliability: Our indicators are meticulously developed to prevent repainting. We strictly adhere to TradingView's coding conventions, ensuring our code is both performant and clean.
█ COMPATIBLE INDICATORS
Each indicator that incorporates our open-source 'azLibConnector' library and adheres to our conventions can be effortlessly integrated and used as detailed above.
For clarity and recognition within the TradingView platform, we append the suffix ' / Connectable' to every compatible indicator.
█ COMMON MISTAKES, CLARIFICATIONS AND TIPS
• Removing an indicator from a chain: Deleting a linked indicator and confirming the "remove study tree" alert will also remove all underlying indicators in the object tree. Before removing one, disconnect the adjacent indicators and move it to the object stack's bottom.
• Point systems: The azLibConnector provides 500 points for each direction (EL: Enter long, XL: Exit long, ES: Enter short, XS: Exit short) Remember this cap when devising a point structure.
• Flow misconfiguration: In daisy chains the first indicator should always have a flow (⌥) setting of 'indicator only' while other indicator should have a flow (⌥) setting of 'both'.
• Hide attributes: As connectable indicators send through quite some information you'll notice all the arguments are taking up some screenwidth and cause some visual clutter. You can disable arguments in Chart Settings / Status line.
• Layout and abbreviations: To maintain a consistent structure, we use abbreviations for each input. While this may initially seem complex, you'll quickly become familiar with them. Each abbreviation is also explained in the inline tooltips.
• Inputs: Connecting a connectable indicator directly to the strategy delivers the raw signal without a weight threshold, meaning every signal will trigger a trade.
█ A NOTE OF GRATITUDE
Through years of exploring TradingView and Pine Script, we've drawn immense inspiration from the community's knowledge and innovation. Thank you for being a constant source of motivation and insight.
█ RISK DISCLAIMER
Azullian's content, tools, scripts, articles, and educational offerings are presented purely for educational and informational uses. Please be aware that past performance should not be considered a predictor of future results.

Bollinger bands / Connectable [Azullian]Deepen your understanding of market volatility using Bollinger Bands. This tool helps in discerning price movements and volatility trends, essential for crafting effective strategies.
This connectable Bollinger bands indicator is part of an indicator system designed to help test, visualize and build strategy configurations without coding. Like all connectable indicators , it interacts through the TradingView input source, which serves as a signal connector to link indicators to each other. All connectable indicators send signal weight to the next node in the system until it reaches either a connectable signal monitor, signal filter and/or strategy.
█ UNIFORM SETTINGS AND A WAY OF WORK
Although connectable indicators may have specific weight scoring conditions, they all aim to follow a standardized general approach to weight scoring settings, as outlined below.
■ Connectable indicators - Settings
• 🗲 Energy: Energy applies an ATR multiplier to the plotted shapes on the chart. A higher value plots shapes farther away from the candle, enhancing visibility.
• ☼ Brightness: Brightness determines the opacity of the shape plotted on the chart, aiding visibility. Indicator weight also influences opacity.
• → Input: Use the input setting to specify a data source for the indicator. Here you can connect the indicator to other indicators.
• ⌥ Flow: Determine where you want to receive signals from:
○ Both: Weights from this indicator and the connected indicator will apply
○ Indicator only: Only weights from this indicator will apply
○ Input only: Only weights from the connected indicator will apply
• ⥅ Weight multiplier: Multiply all weights in the entire indicator by a given factor, useful for quickly testing different indicators in a granular setup.
• ⥇ Threshold: Set a threshold to indicate the minimum amount of weight it should receive to pass it through to the next indicator.
• ⥱ Limiter: Set a hard limit to the maximum amount of weight that can be fed through the indicator.
■ Connectable indicators - Weight scoring settings
▢ Weight scoring conditions
• SM – Signal mode: Enable specific conditions for weight scoring
○ All: All signals will be scored.
○ Entries only: Only entries will score
○ Exits only: Only exits will score.
○ Entries & exits: Both entries and exits will score.
○ Zone: Continuous scoring for each candle within the zone.
• SP – Signal period: Defines a range of candles within which a signal can score.
• SC - Signal count: Specifies the number of bars to retrospectively examine and score.
○ Single: Score for a single occurrence
○ All occurrences: Score for all occurrences
○ Single + Threshold: Score for single occurrences within the signal period (SP)
○ Every + Threshold: Score for all occurrences within the signal period (SP)
▢ Weight scoring direction
• ES: Enter Short weight
• XL: Exit long weight
• EL: Enter Long weight
• XS: Exit Short weight
▢ Weight scoring values
• Weights can hold either positive or negative scores. Positive weights enhance a particular trading direction, while negative weights diminish it.
█ Bollinger bands - INDICATOR SETTINGS
■ Main settings
• Enable/Disable Indicator: Toggle the entire indicator on or off.
• S - Source: Choose an alternative data source for the Bollinger bands calculation.
• T - Timeframe: Select an alternative timeframe for the Bollinger bands calculation.
• LE - Length: Determine the period the bollinger bands are calculated on
• SD - Standard deviation: Determine the standard deviation for the bollinger bands.
• Enable/Disable plotting: Toggle the plotting of the Bollinger bands
• U: Choose a color for the upper band
• B: Choose a color for the basis
• L: Choose a color for the lower band
• BG: Choose a color for Bollinger bands background
■ Scoring functionality
• The Bollinger bands score long entries when the current low price is smaller than the lower band.
• The Bollinger bands score long exits when the current high price is higher than the upper band.
• The Bollinger bands score long zones the entire time the current low price is smaller than the lower band.
• The Bollinger bands score short entries when the current high is higher than the upper band.
• The Bollinger bands score short exits when the current low is smaller than the lower band.
• The Bollinger bands score short zones the entire time the current high price is higher than the upper band.
█ PLOTTING
• Standard: Symbols (EL, XS, ES, XL) appear relative to candles based on set conditions. Their opacity and position vary with weight.
• Conditional Settings: A larger icon appears if global conditions are met. For instance, with a Threshold(⥇) of 12, Signal Period (SP) of 3, and Scoring Condition (SC) set to "EVERY", a Bollinger bands signaling over two times in 3 candles (scoring 6 each) triggers a larger icon.
█ USAGE OF CONNECTABLE INDICATORS
■ Connectable chaining mechanism
Connectable indicators can be connected directly to the signal monitor, signal filter or strategy , or they can be daisy chained to each other while the last indicator in the chain connects to the signal monitor, signal filter or strategy. When using a signal filter you can chain the filter to the strategy input to make your chain complete.
• Direct chaining: Connect an indicator directly to the signal monitor, signal filter or strategy through the provided inputs (→).
• Daisy chaining: Connect indicators using the indicator input (→). The first in a daisy chain should have a flow (⌥) set to 'Indicator only'. Subsequent indicators use 'Both' to pass the previous weight. The final indicator connects to the signal monitor, signal filter, or strategy.
■ Set up this indicator with a signal filter and strategy
The indicator provides visual cues based on signal conditions. However, its weight system is best utilized when paired with a connectable signal filter, signal monitor, and/or strategy .
Let's connect the Bollinger bands to a connectable signal filter and a strategy :
1. Load all relevant indicators
• Load Bollinger bands / Connectable
• Load Signal filter / Connectable
• Load Strategy / Connectable
2. Signal Filter: Connect the Bollinger bands to the Signal Filter
• Open the signal filter settings
• Choose one of the three input dropdowns (1→, 2→, 3→) and choose : Bollinger bands / Connectable: Signal Connector
• Toggle the enable box before the connected input to enable the incoming signal
3. Signal Filter: Update the filter signals settings if needed
• The default settings of the filter enable EL (Enter Long), XL (Exit Long), ES (Enter Short) and XS (Exit Short).
4. Signal Filter: Update the weight threshold settings if needed
• All connectable indicators load by default with a score of 6 for each direction (EL, XL, ES, XS)
• By default, weight threshold (TH) is set at 5. This allows each occurrence to score, as the default score in each connectable indicator is 1 point above the threshold. Adjust to your liking.
5. Strategy: Connect the strategy to the signal filter in the strategy settings
• Select a strategy input → and select the Signal filter: Signal connector
6. Strategy: Enable filter compatible directions
• Set the signal mode of the strategy to a compatible direction with the signal filter.
Now that everything is connected, you'll notice green spikes in the signal filter representing long signals, and red spikes indicating short signals. Trades will also appear on the chart, complemented by a performance overview. Your journey is just beginning: delve into different scoring mechanisms, merge diverse connectable indicators, and craft unique chains. Instantly test your results and discover the potential of your configurations. Dive deep and enjoy the process!
█ BENEFITS
• Adaptable Modular Design: Arrange indicators in diverse structures via direct or daisy chaining, allowing tailored configurations to align with your analysis approach.
• Streamlined Backtesting: Simplify the iterative process of testing and adjusting combinations, facilitating a smoother exploration of potential setups.
• Intuitive Interface: Navigate TradingView with added ease. Integrate desired indicators, adjust settings, and establish alerts without delving into complex code.
• Signal Weight Precision: Leverage granular weight allocation among signals, offering a deeper layer of customization in strategy formulation.
• Advanced Signal Filtering: Define entry and exit conditions with more clarity, granting an added layer of strategy precision.
• Clear Visual Feedback: Distinct visual signals and cues enhance the readability of charts, promoting informed decision-making.
• Standardized Defaults: Indicators are equipped with universally recognized preset settings, ensuring consistency in initial setups across different types like momentum or volatility.
• Reliability: Our indicators are meticulously developed to prevent repainting. We strictly adhere to TradingView's coding conventions, ensuring our code is both performant and clean.
█ COMPATIBLE INDICATORS
Each indicator that incorporates our open-source 'azLibConnector' library and adheres to our conventions can be effortlessly integrated and used as detailed above.
For clarity and recognition within the TradingView platform, we append the suffix ' / Connectable' to every compatible indicator.
█ COMMON MISTAKES, CLARIFICATIONS AND TIPS
• Removing an indicator from a chain: Deleting a linked indicator and confirming the "remove study tree" alert will also remove all underlying indicators in the object tree. Before removing one, disconnect the adjacent indicators and move it to the object stack's bottom.
• Point systems: The azLibConnector provides 500 points for each direction (EL: Enter long, XL: Exit long, ES: Enter short, XS: Exit short) Remember this cap when devising a point structure.
• Flow misconfiguration: In daisy chains the first indicator should always have a flow (⌥) setting of 'indicator only' while other indicator should have a flow (⌥) setting of 'both'.
• Hide attributes: As connectable indicators send through quite some information you'll notice all the arguments are taking up some screenwidth and cause some visual clutter. You can disable arguments in Chart Settings / Status line.
• Layout and abbreviations: To maintain a consistent structure, we use abbreviations for each input. While this may initially seem complex, you'll quickly become familiar with them. Each abbreviation is also explained in the inline tooltips.
• Inputs: Connecting a connectable indicator directly to the strategy delivers the raw signal without a weight threshold, meaning every signal will trigger a trade.
█ A NOTE OF GRATITUDE
Through years of exploring TradingView and Pine Script, we've drawn immense inspiration from the community's knowledge and innovation. Thank you for being a constant source of motivation and insight.
█ RISK DISCLAIMER
Azullian's content, tools, scripts, articles, and educational offerings are presented purely for educational and informational uses. Please be aware that past performance should not be considered a predictor of future results.

RSI Missmatch(Divergence) OSC. by Neo_ with Missmatch Alert█ Definition
A divergence or missmatch occurs when an asset’s price is moving opposite to a specific technical indicator or is moving in a different direction from other relevant data. The divergence indicator warns traders and technical analysts of changes in a price trend, oftentimes that it is weakening or changing direction.
Divergence or missmatch can be either positive, signifying the possibility of a move that is higher in the asset’s price, or it can be negative, signifying the possibility of a move that is lower in the asset’s price.
█ Takeaways
Divergence or missmatch often works with other indicators and data. It is usually used by technical analysts and traders when the asset’s price is moving counter to the direction of another indicator.
As mentioned above, positive divergence or missmatch indicates that the price could start rising and usually occurs when the price is moving lower, but while another indicator counters this direction by moving higher. In other words, showing bullish signals.
Negative divergence or missmatch indicates that the price could start declining and usually occurs when the price is moving higher, while another indicator moves lower as well. In other words, showing bearish signals.
█ What to look for
Divergence or missmatch is most often used to track and analyze the momentum in an asset’s price and the odds of a price reversal within the current trend. While using divergence, traders and analysts can decide on whether or not they would like to exit the position or set a stop loss in the case the divergence is negative and prices begin to fall.
█ Limitations
It is best to use divergence or missmatch with the aid of other indicators and analysis tools in order to help identify and confirm trend reversals and major market patterns. Divergence should not be relied on by itself to tell you the pertinent information you need to know as an investor. Risk control is key in your analysis and the fact that divergence is not always present in price reversals should definitely be what pushes you to combine it with other tools and indicators.
Additionally, divergence or missmatch can reflect long-term or short-term changes. When making snap decisions, acting on divergence alone could prove detrimental to your trading. Make sure you have other risk factors applied to your charting and general market analysis.
█ What exactly is RSI Missmatches discrepancies using a lookback period in trading?
In trading, lookback period is the number of periods of historical data used for observation and calculation. It is how far into the past the system looks when trying to calculate the variable under consideration. The concept was based on the fact that history can provide information about the future, and my aim was to predict the periods when trend changes would begin within these periods with the RSI oscillator. But this is only true if you're locked back far enough, not locked any further or less!
We already use the idea of looking back in different aspects of our lives, and even in the world of financial trading it can be used in various ways. Of course you will want to learn more about the concept, so in this article we will cover the following topics:
█ What kind of hindsight is this?
The aim here is to check whether trends will change in certain cycles, so we chose the High + Low / 2 formula as the source. Because no matter how much the prices swing up or down, sometimes the rebound can go further. The aim here is to notice the points where the price leaves a needle at the levels where it oscillates and the slowdown in momentum.
█ What does look-back period mean in trade?
To understand what a lookback period means in trading, you need to ask yourself: What is a lookback period in trading? In financial trading, period refers to the duration of a particular trading session. For example, a one-week period means one full week of trading sessions or five trading days. In 5 trading days, the average time is 120 hours in FX markets and 40 hours in stock markets. Regardless of what happens in these cycles, I prefer to choose a time period of 55 periods. Because I noticed that in all the charts I examined, the cycles generally changed during this time period.
█ Let's talk about the meaning of catching Missmatches
As you know, technical indicators are all a mathematical calculation using historical market data (price, volume, or a combination of both). It shows the behavior of the price better and helps in the analysis of price movement. But the indicator can only serve your intended purpose if you get the lookback time right. What we mean here is the setting parameter that determines how much historical data it will use in its calculation. In other words, it is the retrospective review period.
For example, on the RSI indicator you can set this period to 13 periods (default setting) or even 2 periods. The period you choose can determine what the indicator tells you, which in turn determines the strategy you can create with the indicator. The 13- period RSI gives you information about price momentum, so you can effectively use it to create a momentum strategy. On the other hand, the 2-periods RSI can be used to create a mean reversion strategy. To catch any incompatibilities, I set this period to 55 periods. Nothing more, nothing less!
█ Summary
The missmatch indicator helps traders assess changes in the price trend and indicates when price will move with or against the direction of another indicator. It can be either positive or negative, but it is important to note its limitations and that it should be used with other indicators that can also monitor price trends.
We wish you to identify these incompatibilities in the market in the best way possible... Good luck.
█ Tanım
Bir varlığın fiyatı belirli bir teknik göstergenin tersi yönünde hareket ettiğinde veya diğer ilgili verilerden farklı bir yönde hareket ettiğinde bir sapma veya uyumsuzluk meydana gelir. Farklılık göstergesi, tüccarları ve teknik analistleri fiyat eğilimindeki değişiklikler konusunda uyarır; çoğu zaman zayıflıyor veya yön değiştiriyor.
Farklılık veya uyumsuzluk, varlığın fiyatında daha yüksek bir hareket olasılığını işaret ederek pozitif olabilir veya varlığın fiyatında daha düşük bir hareket olasılığını işaret ederek negatif olabilir.
█ Çıkarımlar
Farklılık veya uyumsuzluk çoğu zaman diğer göstergeler ve verilerle de çalışır. Genellikle teknik analistler ve yatırımcılar tarafından varlığın fiyatı başka bir göstergenin yönünün tersine hareket ettiğinde kullanılır.
Yukarıda bahsedildiği gibi pozitif sapma veya uyumsuzluk, fiyatın yükselmeye başlayabileceğini gösterir ve genellikle fiyat düşerken meydana gelir, ancak başka bir gösterge bu yöne yükselerek karşı koyar. Başka bir deyişle yükseliş sinyalleri veriyor.
Negatif sapma veya uyumsuzluk, fiyatın düşmeye başlayabileceğini gösterir ve genellikle fiyat yükselirken başka bir gösterge de düşerken meydana gelir. Başka bir deyişle düşüş sinyalleri veriyor.
█ Nelere bakılmalı
Farklılık veya uyumsuzluk çoğunlukla bir varlığın fiyatındaki momentumu ve mevcut trend içinde fiyatın tersine dönme olasılığını izlemek ve analiz etmek için kullanılır. Farklılaşmayı kullanırken tüccarlar ve analistler, sapmanın negatif olması ve fiyatların düşmeye başlaması durumunda pozisyondan çıkmak isteyip istemeyeceklerine veya zararı durdurma kararı verip veremeyeceklerine karar verebilirler.
█ Sınırlamalar
Trend dönüşlerini ve ana piyasa modellerini tanımlamaya ve doğrulamaya yardımcı olmak için diğer göstergeler ve analiz araçlarının yardımıyla sapmayı veya uyumsuzluğu kullanmak en iyisidir. Bir yatırımcı olarak bilmeniz gereken ilgili bilgileri size söylemesi için farklılığa tek başına güvenilmemelidir. Risk kontrolü analizinizin anahtarıdır ve fiyat dönüşlerinde farklılığın her zaman mevcut olmaması gerçeği kesinlikle sizi onu diğer araç ve göstergelerle birleştirmeye iten şey olmalıdır.
Ek olarak, farklılık veya uyumsuzluk uzun vadeli veya kısa vadeli değişiklikleri yansıtabilir. Ani kararlar verirken yalnızca farklılıklara göre hareket etmek ticaretinize zarar verebilir. Grafiğinize ve genel piyasa analizinize başka risk faktörlerinin uygulandığından emin olun.
█ Ticarette yeniden inceleme dönemi kullanan RSI Missmatches tutarsızlıkları tam olarak nedir?
Ticarette yeniden inceleme süresi, gözlem ve hesaplama için kullanılan geçmiş verilerin dönemlerinin sayısıdır. Söz konusu değişkeni hesaplamaya çalışırken sistemin ne kadar geçmişe baktığıdır. Konsept tarihin geleceğe dair bilgi verebileceği gerçeği üzerine kuruluydu ve amacım RSI osilatörü ile bu dönemler içerisinde trend değişimlerinin başlayacağı dönemleri tahmin etmekti. Ancak bu yalnızca yeterince geriye kilitlenmişseniz geçerlidir, daha fazla veya daha az kilitlenmemişseniz!
Geriye bakma fikrini hayatımızın farklı yönlerinde zaten kullanıyoruz ve hatta finansal ticaret dünyasında bile bu fikir çeşitli şekillerde kullanılabilir. Elbette konsept hakkında daha fazla bilgi edinmek isteyeceksiniz, bu nedenle bu yazıda aşağıdaki konuları ele alacağız:
█ Bu nasıl bir sonradan görmedir?
Burada amaç belli döngülerde trendlerin değişip değişmeyeceğini kontrol etmek olduğundan kaynak olarak Yüksek + Düşük / 2 formülünü seçtik. Çünkü fiyatlar ne kadar yukarı veya aşağı hareket ederse etsin bazen toparlanma daha da ileri gidebiliyor. Burada amaç fiyatın salınım yaptığı seviyelerde iğne bıraktığı noktaları ve momentumdaki yavaşlamayı fark etmektir.
█ Ticarette geriye bakma süresi ne anlama geliyor?
Ticarette yeniden inceleme süresinin ne anlama geldiğini anlamak için kendinize şu soruyu sormanız gerekir: Ticarette yeniden inceleme süresi nedir? Finansal ticarette dönem, belirli bir ticaret seansının süresini ifade eder. Örneğin, bir haftalık dönem, bir tam haftalık işlem seansı veya beş işlem günü anlamına gelir. 5 işlem gününde ortalama süre döviz piyasalarında 120 saat, borsalarda ise 40 saattir. Bu döngülerde ne olursa olsun 55 periyotluk bir zaman dilimini seçmeyi tercih ediyorum. Çünkü incelediğim tüm grafiklerde bu zaman diliminde döngülerin genel olarak değiştiğini fark ettim.
█ Kaçak Eşleşmeleri yakalamanın anlamı hakkında konuşalım
Bildiğiniz gibi teknik göstergeler, geçmiş piyasa verileri (fiyat, hacim veya her ikisinin birleşimi) kullanılarak yapılan matematiksel hesaplamalardır. Fiyatın davranışını daha iyi gösterir ve fiyat hareketinin analizine yardımcı olur. Ancak gösterge yalnızca yeniden inceleme süresini doğru yaparsanız amacınıza hizmet edebilir. Burada kast ettiğimiz, hesaplamasında ne kadar geçmiş veri kullanacağını belirleyen ayar parametresidir. Bir başka deyişle geriye dönük inceleme dönemidir.
Örneğin RSI göstergesinde bu süreyi 13 döneme (varsayılan ayar) ve hatta 2 döneme ayarlayabilirsiniz. Seçeceğiniz dönem, göstergenin size ne söyleyeceğini belirleyebilir ve bu da gösterge ile oluşturabileceğiniz stratejiyi belirler. 13 dönemlik RSI size fiyat momentumu hakkında bilgi verir, böylece onu bir momentum stratejisi oluşturmak için etkili bir şekilde kullanabilirsiniz. Öte yandan, ortalamaya dönüş stratejisi oluşturmak için 2 dönemlik RSI kullanılabilir. Herhangi bir uyumsuzluğu yakalamak için bu periyodu 55 periyoda ayarladım. Ne fazla ne eksik!
█ Özet
Uyumsuzluk göstergesi, yatırımcıların fiyat eğilimindeki değişiklikleri değerlendirmesine yardımcı olur ve fiyatın ne zaman başka bir göstergenin yönüne göre veya ona karşı hareket edeceğini gösterir. Olumlu ya da olumsuz olabilir, ancak sınırlamalarına dikkat etmek ve fiyat eğilimlerini de izleyebilecek diğer göstergelerle birlikte kullanılması gerektiğini unutmamak önemlidir.
Piyasadaki bu uyumsuzlukları en iyi şekilde tespit etmenizi dileriz... Bol Kazançlar.
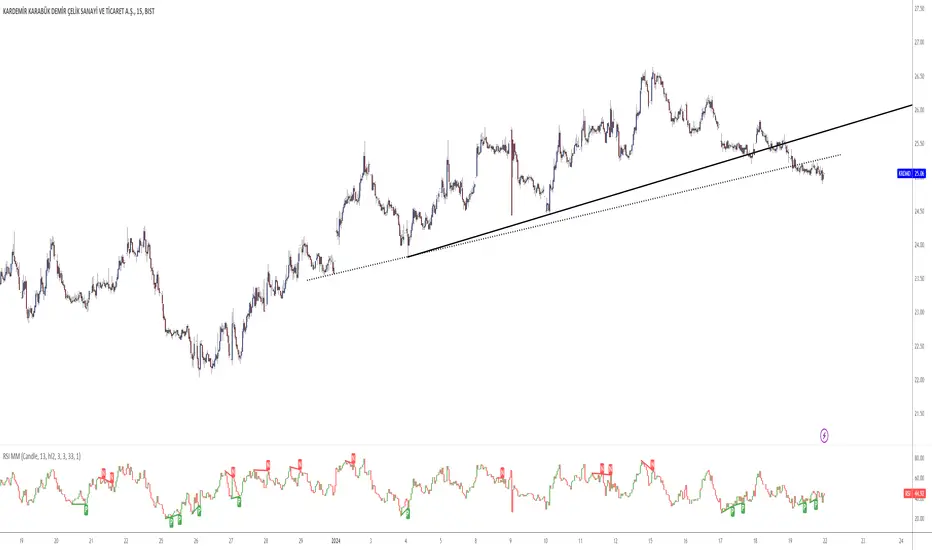
VARGAS"VARGAS" is an indicator that can be used in all timeframes on charts in the stock, crypto, and commodity markets. It allows trades to be opened according to the intersections of moving averages in different time periods.
It is an indicator using weighted moving averages. Using a weighted moving average has the following benefits for traders:
1) Precision and Smoothness: The WMA typically gives more weight to recent prices and therefore reacts faster to more recent data. This helps you catch price movements faster and recognize trend changes faster. On the other hand, the WMA is smoother than the simple moving average (SMA), which makes it less likely to generate false signals.
2) Trend Identification: The WMA is used to identify and analyze price trends. It is especially important for traders who want to track short-term movements. The WMA is used to assess the direction and strength of the trend.
3) Trading Signals: The WMA is used as part of various trading strategies. It is especially used in moving average crossover strategies. For example, a short-term WMA crossing the long-term WMA to the upside can be considered a buy signal, while a reversal can be interpreted as a sell signal.
4) Adaptability to Volatility: WMA can adapt to volatility by changing weighting factors. Investors can adopt a more flexible approach by assigning different weights based on market conditions and asset classes.
5) Data Correction: WMA can be helpful in reducing data noise. A single large price fluctuation can cause the SMA to be more affected, while the WMA reduces the impact of these fluctuations.
In our VARGAS coding, the intersection times of the 9-day and 15-day weighted moving averages allow us to decide the direction of the trend. The green and red cloud areas following the price candles make the strategy easy for the user to follow.
At the intersection between the 9-day weighted moving average and the 15-day weighted moving average, we can use buy and sell signals as follows:
If the 9-day weighted moving average crosses the 15-day weighted moving average upwards, buy,
Sell if the 9-day weighted moving average crosses the 15-day weighted moving average downwards.
Within the scope of this strategy, GOLDEN CROSS and DEATH CROSS intersections, which guide us for trend changes, are also included in the coding. Thus, it is aimed to add strength to our WMA 9 and WMA 15 intersection strategy as an idea.
VARGAS indicator gives better results for longer periods of 4 hours and above. As the time period increases, the probability of correct results will increase.
**
"VARGAS" hisse senedi, kripto, ve emtia piyasalarındaki grafiklerde her türlü zaman diliminde kullanılabilen bir indikatördür. Farklı zaman periyotlarındaki hareketli ortalamaların kesişimlerine göre işlem açılmasını sağlar.
Ağırlıklı hareketli ortalamalar kullanılarak hazırlanmış bir göstergedir. Ağırlıklı hareketli ortalama kullanmanın yatırımcılara aşağıdaki gibi faydaları bulunmaktadır:
1) Duyarlılık ve Pürüzsüzlük: WMA, tipik olarak son dönem fiyatlarına daha fazla ağırlık verir ve bu nedenle daha güncel verilere daha hızlı tepki verir. Bu, fiyat hareketlerini daha hızlı yakalamanıza ve daha hızlı trend değişikliklerini tanımanıza yardımcı olur. Diğer yandan, WMA, basit hareketli ortalamaya (SMA) göre daha pürüzsüzdür, bu da yanlış sinyal üretme olasılığını azaltır.
2) Trend Belirleme: WMA, fiyat trendlerini belirlemek ve analiz etmek için kullanılır. Özellikle kısa vadeli hareketleri izlemek isteyen yatırımcılar için önemlidir. WMA, trendin yönünü ve gücünü değerlendirmek için kullanılır.
3) Ticaret Sinyalleri: WMA, çeşitli ticaret stratejilerinin bir parçası olarak kullanılır. Özellikle hareketli ortalama crossover stratejilerinde kullanılır. Örneğin, kısa vadeli WMA'nın uzun vadeli WMA'yı yukarı yönlü kesmesi bir alım sinyali olarak kabul edilebilir, tersine dönmesi ise bir satış sinyali olarak yorumlanabilir.
4) Volatiliteye Uyarlanabilirlik: WMA, ağırlıklandırma faktörlerini değiştirerek volatiliteye uyum sağlayabilir. Yatırımcılar, piyasa koşullarına ve varlık sınıflarına göre farklı ağırlıklar atayarak daha esnek bir yaklaşım benimseyebilirler.
5) Veri Düzeltme: WMA, veri gürültüsünü azaltmada yardımcı olabilir. Tek bir büyük fiyat dalgalanması, SMA'nın daha fazla etkilenmesine neden olabilirken, WMA bu dalgalanmaların etkisini azaltır.
VARGAS isimli kodlamamızda ise 9 günlük ve 15 günlük ağırlıklı hareketli ortalamaların kesişme zamanları trendin yönüne karar vermemizi sağlar. Fiyat mumlarını takip eden yeşil ve kırmızı bulut alanları stratejinin kullanıcı tarafından kolaylıkla takip edilmesini sağlamaktadır.
9 Günlük Ağırlıklı hareketli ortalama, 15 Günlük Ağırlıklı hareketli ortalama arasındaki kesişimde al ve sat sinyallerini şu şekilde kullanabiliriz:
Eğer 9 günlük ağırlıklı hareketli ortalama 15 günlük ağırlıklı hareketli ortalamayı yukarı doğru kesiyorsa al,
Eğer 9 günlük ağırlıklı hareketli ortalama, 15 günlük ağırlıklı hareketli ortalamayı aşağı doğru keserse sat.
Bu strateji kapsamında trend değişimleri için bizlere yön veren GOLDEN CROSS ve DEATH CROSS kesişimleri de kodlamanın içerisinde dahil edilmiştir. Böylelikle WMA 9 ve WMA 15 kesişim stratejimize fikir olarak güç katması hedeflenmiştir.
VARGAS indikatörü 4 saat ve üzeri daha uzun periyotlarda daha iyi sonuçlar vermektedir. Zaman periyodu büyüdükçe doğru sonuç verme olasılığı artacaktır.

Hammer pattern with filtered alerts and close conditionA hammer is a price pattern in candlestick charting that occurs when a security trades significantly lower than its opening, but rallies within the period to close near opening price. This pattern forms a hammer-shaped candlestick, in which the lower shadow is at least twice the size of the real body. The body of the candlestick represents the difference between the open and closing prices, while the shadow shows the high and low prices for the period.
KEY TAKEAWAYS
Hammers have a small real body and a long lower shadow.
Hammers occur after a price decline.
The hammer candlestick shows sellers came into the market during the period but by the close the selling had been absorbed and buyers had pushed the price back to near the open.
The close can be above or below the open, although the close should be near the open in order for the real body to remain small.
The lower shadow should be at least two times the height of the real body.
Hammer candlesticks indicate a potential price reversal to the upside. The price must start moving up following the hammer; this is called confirmation.
The study enhances standard Hammer pattern accuracy by clearing out market noises and manipulations from the indicator's triggers. Combination of Volume oscillator filter and Directional Movement Index (DMI) components values adjustments allows to detect only strong signals while RSI bands indicator is used to find the safiest signals' closure moments.
The indicator can be applied to trading pairs with USD, USDT, ETH and BTC quote currencies. It is better to check the recent performance on each particular trading pair before apply it. The Indicator supports spot, futures and marginal trading exchanges. The best performance is obtained while using at 30m timeframe and for scalping signals
Advantages of this indicator:
1. Weak signals and market noises are filtered. This allows to receive only strong and confirmed alerts
2. The indicator includes both
Study with built-in custom alerts to use with your own software through web hook connection.
Strategy with configurable risk management settings (order size, commission, take profit, stop loss and trailing). This provides you opportunity of direct broker connection and allows to conduct backtests before applying the strategy to real account
How to use?
Long signals:
1. Apply indicator to the trading pair your are interested in at 30m timeframe chart
2. Once conditions are met price action candle will be colored yellow and H label will be drawn. Place a long position and wait. The
3. Once price action breaks RSI resistance band, retraces and closes below the band the signal is finished and the position should be closed
Automatic strategy:
When conditions of long or short position from the strategy are met the script opens position.
Strategy.exit closes the position once risk management settings are met.
Strategy.close closes the position once RSI band rejection is confirmed
If you want to obtain access to the indicator please send us a personal message
Feel free to favorite the script, apply it to a chart. If you want to obtain access to the indicator please send us a personal message or leave a comment

Dragonfly Doji with DMI and Volume FiltersA Dragonfly Doji is a type of candlestick pattern that can signal a potential reversal in price to the downside or upside, depending on past price action. It's formed when the asset's high, open, and close prices are the same. The long lower shadow suggests that there was aggressive selling during the period of the candle, but since the price closed near the open it shows that buyers were able to absorb the selling and push the price back up.
The study enhances standard Dragonfly Doji accuracy by clearing out market noises and manipulations from the indicator's triggers. Specially selected values of Directional Movement Index (DMI) components detect only strong signals while RSI bands indicator is used to find the safiest signals' closure moments.
The indicator can be applied to trading pairs with USD, USDT, ETH and BTC quote currencies. It is better to check the recent performance on each particular trading pair before apply it. The Indicator supports spot, futures and marginal trading exchanges. The best performance is obtained while using at 15m timeframe and for scalping signals
Advantages of this indicator:
1. Weak signals and market noises are filtered. This allows to receive only strong and confirmed alerts
2. The indicator includes both
Study with built-in custom alerts to use with your own software through web hook connection.
Strategy with configurable risk management settings (order size, commission, take profit, stop loss and trailing). This provides you opportunity of direct broker connection and allows to conduct backtests before applying the strategy to real account
How to use?
Long signals:
1. Apply indicator to the trading pair your are interested in at 15m timeframe chart
2. Once conditions are met price action candle will be colored yellow and DD label will be drawn. Place a long position and wait. The
3. Once price action breaks RSI resistance band, retraces and closes below the band the signal is finished and the position should be closed
Automatic strategy:
When conditions of long or short position from the strategy are met the script opens position.
Strategy.exit closes the position once risk management settings are met.
Strategy.close closes the position once RSI band rejection is confirmed
If you want to obtain access to the indicator please send us a personal message
If you want to obtain access to the indicator please send us a personal message or leave a comment

Bullish and Bearish Engulfing and RSI, DMI and PSAR confirmationThe study combines Bearish and Bullish Engulfing pivot strategy with strong trend confirmative indicators:
Directional Movement Index (DMI)
Parabolic SAR
RSI Bands
Engulfing patterns in market provide a useful way for traders to enter the market in anticipation of a possible reversal in the trend. Engulfing candles tend to signal a reversal of the current trend in the market. This specific pattern involves two candles with the latter candle "engulfing" the entire body of the candle before it. The engulfing candle can be bullish or bearish depending on where it forms in relation to the existing trend
The indicator can be applied to trading pairs with USD, USDT, ETH and BTC quote currencies. Indicator supports spot, futures and marginal trading exchanges. It calculates and compares values of the price action candles to define is there an engulfing and what type it is: bullish or bearish:
If there is a bullish engulfing the indicator fills price action candle with yellow color
If there is a bearish engulfing the indicator fills price action candle with purple color
Advantages of this indicator:
1. This indicator reveals presence of both types of engulfing simultaneously
2. Weak engulfment signals and market noises are filtered by RSI bands, DMI and PSAR confirmations. This allows to receive only strong and confirmed engulfments
3. This indicator includes both
Study with built-in custom alerts to use with your own software through web hook connection.
Strategy with configurable risk management settings (order size, commission, take profit, stop loss and trailing). This provides you opportunity of direct broker connection and allows to conduct backtests before applying the strategy to real account
At the chart you can see the historical price action of XBTUSD at BitMEX exchange from 9th of May 2020 till 17th of May 2020 indicator. Moments when the indicator triggered to enter a position are described with message clouds. Moments when a certain position should be closed are highlighted with circles and commented with clouds
How to use?
Long signals:
1. Apply indicator to the trading pair your are interested in
2. Once bullish engulfing conditions are met price action candle will be colored yellow.
3. Once price action breaks RSI resistance band, retraces and closes below the band the signal is finished and the position should be closed
Short signals:
1. Apply indicator to the trading pair your are interested in
2. Once bearish engulfing conditions are met price action candle will be colored purple.
3. Once price action breaks RSI support band, retraces and closes above the band the signal is finished and the position should be closed
Automatic strategy:
When conditions of long or short position from the strategy are met the script opens position.
Strategy.exit closes the position once risk management settings are met.
Strategy.close closes the position once RSI band rejection is confirmed
If you want to obtain access to the indicator please send us a personal message
Best regards,
SkyRock Signals team

40 Ticker Cross-Sectional Z-Scores [BackQuant]40 Ticker Cross-Sectional Z-Scores
BackQuant’s 40 Ticker Cross-Sectional Z-Scores is a powerful portfolio management strategy that analyzes the relative performance of up to 40 different assets, comparing them on a cross-sectional basis to identify the top and bottom performers. This indicator computes Z-scores for each asset based on their log returns and evaluates them relative to the mean and standard deviation over a rolling window. The Z-scores represent how far an asset's return deviates from the average, and these values are used to rank the assets, allowing for dynamic asset allocation based on performance.
By focusing on the strongest-performing assets and avoiding the weakest, this strategy aims to enhance returns while managing risk. Additionally, by adjusting for standard deviations, the system offers a risk-adjusted method of ranking assets, making it suitable for traders who want to dynamically allocate capital based on performance metrics rather than just price movements.
Key Features
1. Cross-Sectional Z-Score Calculation:
The system calculates Z-scores for 40 different assets, evaluating their log returns against the mean and standard deviation over a rolling window. This enables users to assess the relative performance of each asset dynamically, highlighting which assets are performing better or worse compared to their historical norms. The Z-score is a useful statistical tool for identifying outliers in asset performance.
2. Asset Ranking and Allocation:
The system ranks assets based on their Z-scores and allocates capital to the top performers. It identifies the top and bottom assets, and traders can allocate capital to the top-performing assets, ensuring that their portfolio is aligned with the best performers. Conversely, the bottom assets are removed from the portfolio, reducing exposure to underperforming assets.
3. Rolling Window for Mean and Standard Deviation Calculations:
The Z-scores are calculated based on rolling means and standard deviations, making the system adaptive to changing market conditions. This rolling calculation window allows the strategy to adjust to recent performance trends and minimize the impact of outdated data.
4. Mean and Standard Deviation Visualization:
The script provides real-time visualizations of the mean (x̄) and standard deviation (σ) of asset returns, helping traders quickly identify trends and volatility in their portfolio. These visual indicators are useful for understanding the current market environment and making more informed allocation decisions.
5. Top & Bottom Performer Tables:
The system generates tables that display the top and bottom performers, ranked by their Z-scores. Traders can quickly see which assets are outperforming and underperforming. These tables provide clear and actionable insights, helping traders make informed decisions about which assets to include in their portfolio.
6. Customizable Parameters:
The strategy allows traders to customize several key parameters, including:
Rolling Calculation Window: Set the window size for the rolling mean and standard deviation calculations.
Top & Bottom Tickers: Choose how many of the top and bottom assets to display and allocate capital to.
Table Orientation: Select between vertical or horizontal table formats to suit the user’s preference.
7. Forward Test & Out-of-Sample Testing:
The system includes out-of-sample forward tests, ensuring that the strategy is evaluated based on real-time performance, not just historical data. This forward testing approach helps validate the robustness of the strategy in dynamic market conditions.
8. Visual Feedback and Alerts:
The system provides visual feedback on the current asset rankings and allocations, with dynamic labels and plots on the chart. Additionally, users receive alerts when allocations change, keeping them informed of important adjustments.
9. Risk Management via Z-Scores and Std Dev:
The system’s approach to asset selection is based on Z-scores, which normalize performance relative to the historical mean. By incorporating standard deviation, it accounts for the volatility and risk associated with each asset. This allows for more precise risk management and portfolio construction.
10. Note on Mean Reversion Strategy:
If you take the inverse of the signals provided by this indicator, the strategy can be used for mean-reversion rather than trend-following. This would involve buying the underperforming assets and selling the outperforming ones. However, it's important to note that this approach does not work well with highly correlated assets, as the relationship between the assets could result in the same directional movement, undermining the effectiveness of the mean-reversion strategy.
References
www.uts.edu.au
onlinelibrary.wiley.com
www.cmegroup.com
Final Thoughts
The 40 Ticker Cross-Sectional Z-Scores strategy offers a data-driven approach to portfolio management, dynamically allocating capital based on the relative performance of assets. By using Z-scores and standard deviations, this strategy ensures that capital is directed to the strongest performers while avoiding weaker assets, ultimately improving the risk-adjusted returns of the portfolio. Whether you’re focused on trend-following or looking to explore mean-reversion strategies, this flexible system can be tailored to suit your investment goals.

EMA Cross Strategy + Breakout Entry (Trend Filtered)A High-Probability Trading Strategy Using EMAs and Long-Term Trend Filters in Pine Script
In financial markets, successful trading often depends on identifying high-probability setups with consistent rules and clear confirmations. The Pine Script developed here combines the simplicity of exponential moving average (EMA) crossovers with the robustness of long-term trend filtering, enhancing entry timing and reducing exposure to false signals. This essay explains the strategy’s logic, technical components, strengths, and its potential effectiveness for active traders.
Introduction to the Strategy
This Pine Script trading strategy is built upon two foundational components:
1. EMA Crossovers: A well-established technique where a fast EMA (8-period) and a slower EMA (21-period) are used to detect short-term momentum shifts.
2. Trend Filtering Using SMA: A 100-period simple moving average (SMA) acts as a long-term trend indicator. Only trades in the direction of the dominant trend are considered valid.
These two elements are combined to create a high-probability, trend-following system that aims to capture meaningful price movements while avoiding low-quality entries that typically occur during sideways or choppy markets.
⸻
Core Entry Logic
The script defines two distinct entry conditions designed to complement each other:
1. Standard EMA Crossover Entry (Type A)
This is a classic momentum entry condition. When the 8 EMA crosses above the 21 EMA, it indicates a shift in short-term momentum. However, this signal alone is insufficient in many market conditions, especially when the broader trend is unclear or reversing. To mitigate this risk, the crossover is only accepted when the 100 SMA is in an uptrend, defined as the SMA currently being higher than its value on the previous bar. This ensures the strategy only takes long entries in bullish environments, aligning with the principle of trading with the trend.
2. Breakout Entry After Trend Reversal (Type B)
The second entry condition captures powerful “breakout” opportunities that often follow a fresh trend reversal. Specifically, when the 100 SMA transitions from a downtrend to an uptrend, the script starts a 15-bar lookback window. If, during that window, the price, 8 EMA, and 21 EMA all rise above the long-term SMA, it is considered a confirmation of trend strength and momentum alignment. A long entry is then signaled.
This condition is designed to capitalize on early participation in new uptrends, catching strong price expansions that typically follow a change in market direction.
⸻
Exit Logic
The exit logic is intentionally simple and tied to the same framework as entries. A position is exited when the 8 EMA crosses below the 21 EMA, and the 100 SMA remains in an uptrend. This ensures that exits are aligned with weakening momentum while the larger trend remains bullish. This avoids premature exits during minor pullbacks and focuses on retaining trades during sustained uptrends.
Notably, exits do not occur when the long-term trend has flipped bearish. This design choice prevents “reverse trend” noise from triggering exits too early and instead focuses purely on short-term weakness within a bullish macro backdrop.
⸻
Technical Components of the Script
The Pine Script is structured with clear and logical components:
1. Inputs: The user can customize the periods for the fast EMA, slow EMA, long-term SMA, and the trend-reversal lookback window (defaulted to 15 bars).
2. Trend Detection: The long-term trend is calculated using the slope of the 100 SMA. If the SMA is rising, the trend is marked as bullish and is visually plotted in green; otherwise, it is plotted in red.
3. State Management: The script tracks how many bars have passed since the long-term trend turned bullish. This is managed using a var integer variable that resets upon trend reversal and increments while the trend remains up.
4. Entry and Exit Signals: These are plotted as shape markers on the chart — green triangles for entry and red triangles for exit — providing visual clarity.
Each of these components works in harmony to ensure that trade signals are issued only in favorable environments with multiple confirmations.
⸻
Benefits of the Strategy
There are several key advantages to using this hybrid strategy:
1. Filters Out Choppy Markets
By requiring the long-term SMA to be in an uptrend for any entry or exit signal to be valid, the strategy avoids noisy, sideways price action where EMA crossovers are more likely to produce false signals.
2. Dual Entry Approach
The inclusion of two different entry types allows the strategy to both:
• Capture new trends as they emerge (Breakout Entry).
• Ride existing trends using EMA crossover logic (Standard Entry).
This dual approach balances early participation with trend confirmation, offering flexibility for different market conditions.
3. Clear Exit Criteria
By tying exits to a momentum weakening signal (EMA crossover down), traders are not left guessing when to exit. This supports consistent execution and reduces emotional decision-making.
4. Trend Alignment
Aligning both entry and exit decisions with the broader trend increases the probability that trades will move in the desired direction. This is a cornerstone of successful trend-following strategies.
5. Modular Design
The script’s modularity allows traders to easily expand it with backtesting functions, alerts, or additional filters like RSI, ATR, or volume-based conditions, depending on their individual trading needs.
⸻
Use Cases and Applications
This strategy is particularly well-suited for swing traders and position traders operating on the 4-hour or daily timeframes. It is also effective on trending assets like equity indices, major stocks, or cryptocurrencies with defined directional movement.
Additionally, this script can be used as a signal engine in a larger portfolio of strategies, where only trades with trend confirmation are allowed to proceed. It can also function as a discretionary trading aid, helping traders visually identify when technical conditions align favorably.
⸻
Conclusion
This enhanced EMA crossover strategy, powered by a long-term trend filter and a secondary breakout entry condition, offers a robust and disciplined approach to navigating financial markets. By focusing on trading in the direction of a confirmed uptrend and using both momentum and structural price behavior for entry confirmation, the strategy aims to minimize whipsaw trades and maximize participation in sustained bullish moves.
Its simple logic, visual clarity, and strong filtering mechanisms make it both practical for new traders and a valuable foundation for more advanced systems. Whether used as-is or further expanded with custom features, this Pine Script serves as an excellent tool for executing a structured, high-probability trading plan.

Ripster Trend Labels LT INTRODUCTION
Ripster Trend Labels are Extension of Ripster Clouds on Daily & Hourly & Weekly Timeframe for Long Term Analysis for Swing Traders and Investors
Key Components of the Code:
Initialization:
The script starts with the study function, which sets up the overlay on the chart and titles it "Ripster Trend Labels LT".
Users can customize the position of the trend table on the chart via an input option that allows selection among various placements like top_right, top_center, etc.
EMA Calculations:
Daily EMAs: The script calculates two daily EMAs (21-day and 55-day) using the security function to fetch the daily closing prices, ensuring no lookahead bias.
Weekly EMAs: Similarly, it calculates two weekly EMAs (12-week and 50-week) using weekly closing prices.
1-Hour EMA: A 50-period EMA is calculated based on 1-hour closing prices
Trend Label Determination:
For each timeframe (1-hour, daily, and weekly), the script compares the closing prices with their respective EMAs to determine if the trend is bullish or bearish.
Labels like "Bullish" or "Bearish" are dynamically generated based on these comparisons and are updated in real-time as new data becomes available.
Table Creation and Display:
A table is dynamically generated at the user-specified position on the chart.
The table has rows corresponding to each analyzed timeframe, displaying trend labels which are color-coded (green for bullish, red for bearish) to provide visual cues about the market condition.
Explanation of the Clouds & How to Use:
The strategy employs a multi-timeframe analysis using EMA-based "clouds" to evaluate stock trends from short-term fluctuations to long-term movements. This method allows traders to systematically identify potential bullish reversals or signs of a bearish trend weakening, and to make informed decisions based on the overall alignment of these clouds.
Sequence of Cloud Shifts for Trend Analysis:
Ripster 1-Hour Cloud (34/50 1HR): The first indicator to respond, a bullish shift here signals the initial potential for upward momentum. It serves as an early alert for traders to monitor subsequent clouds for confirmation of trend reversal.
MTF1 20/21 Daily Cloud: A bullish turn following the Ripster 1-Hour Cloud strengthens the reversal signal on a daily timeframe. This cloud's shift adds reliability to the initial bullish signal by confirming sustained daily trend strength.
MTF2 50/55 Daily Cloud: Further confirmation comes from this cloud turning bullish, which underscores a robust daily bullish trend. It solidifies the market's bullish sentiment, indicating a sustainable upward trend.
Weekly 5/12 Cloud: This intermediate-term indicator turning bullish consolidates the bullish signals from shorter timeframes, indicating broader market acceptance and strength of the bullish trend.
Weekly 34/50 Cloud: The bullish shift in this cloud confirms a long-term bullish trend. This is a critical confirmation for long-term traders, indicating that the stock might be entering a strong and sustained upward trajectory.
Overall Cloud Alignment and Strategic Implication ns:
All Clouds Are Bullish: When every cloud from the 1-Hour to the Weekly 34/50 is bullish, it signals a strong, unified bullish market sentiment.
Strategy for Bullish Alignment: Traders should view this as an optimal condition for buying dips. The unanimous bullish signal across all timeframes suggests that any pullbacks are temporary, offering buying opportunities.
Using Other Analysis: Enhance this strategy by confirming dips with other bullish indicators like rebounding from key support resistance levels or any other technical analysis
All Clouds Are Bearish: A bearish alignment across all clouds indicates a pervasive downtrend.
Strategy for Bearish Alignment: Traders are advised to avoid long positions and consider risk management strategies, such as tightening stop-losses or taking short positions.
Complementary Analysis: Confirm bearish trends with additional indicators like breakdowns below key support levels etc
Conclusion:
This cloud-based trend analysis provides a structured way to track market dynamics across multiple timeframes, offering clear signals for entry and exit strategies. By observing the sequential shifts in these clouds, traders can align their trading strategies with both short-term and long-term market trends, enhancing their decision-making process. The integration of other technical tools with this cloud-based analysis not only validates the trend signals but also helps in managing trades more effectively, capitalizing on the comprehensive view of market conditions provided by the clouds.

BUY & SELL Dynamic DCA StrategyOverview
The BUY & SELL Dynamic DCA Strategy is a versatile Pine Script indicator designed for traders seeking a robust Dollar Cost Averaging (DCA) approach to manage both long and short positions across various market conditions and timeframes. This innovative tool combines breakout-based level initiation with a dynamic volatility adjustment, enabling traders to enter positions at optimal DCA points, average them strategically, and manage risk with adjustable stop-loss and take-profit levels. Ideal for scalping on short timeframes (1-minute, 5-minute) or swing trading on longer ones (15-minute, 1-hour, 4-hour).
Purpose and Originality
The "BUY & SELL Dynamic DCA Strategy" stands out by integrating several trading concepts into a cohesive, trader-friendly system. While it leverages familiar elements like breakout points and ATR (Average True Range), its originality lies in:
Dynamic Volatility Adjustment: A custom volatility factor, derived from a capped ATR calculation, dynamically scales DCA entry, averaging, and stop-loss levels. This ensures the strategy adapts to market conditions, tightening in low volatility for scalping and widening in high volatility for swing trading.
Dual-Direction DCA: Supports both buy (long) entries on pullbacks and sell (short) entries on rallies, with tailored averaging and exit strategies for each.
Timeframe Versatility: Adjusts its sensitivity based on the chart timeframe, making it suitable for rapid scalping or longer-term trend riding without requiring manual recalibration.
This unique synthesis justifies its publication as a invite-only script, offering a practical tool that enhances traditional DCA methods with adaptive precision.
How It Works
The indicator operates through a multi-step process designed to optimize entry, averaging, and exit points:
1. Initial Level Setting:
Utilizes high and low threshold (calculated over a user-defined period) to establish initial DCA entry levels. If no threshold is detected, it defaults to the previous bar’s price, ensuring immediate applicability.
2. Dynamic DCA Entry:
Entry levels are adjusted using a proprietary volatility factor, which scales the distance from the current price. Long entries trigger when the price falls below this level, while short entries trigger when the price rises above it, with a volume confirmation filter to reduce noise.
3. Averaging Mechanism:
A secondary level (Averaging Level) allows traders to add to their position when the price moves further against the trade (down for longs, up for shorts). This level is also volatility-adjusted, providing a structured cost-reduction strategy.
4. Risk and Reward Management:
A Final Stop-Loss (Final SL) is set farther out, calculated as a multiple of the volatility-adjusted risk distance, offering protection after averaging.
Take-Profit (TP) levels are determined using a user-defined risk-to-reward ratio, ensuring a balanced exit strategy tailored to market movement.
5. Performance Tracking:
A real-time win/loss table in the top-right corner records trade outcomes, with wins and losses color-coded based on the trade direction (green/red for long, red/green for short), aiding performance evaluation.
Features
1. Dual-Mode Operation : Facilitates both long entries on price dips and short entries on price surges, adaptable to bullish and bearish markets.
2. Volatility-Adaptive Levels: Employs a custom ATR-based adjustment to scale entry, averaging, and stop-loss levels, enhancing responsiveness across timeframes.
3. Visual Tools: Features dashed lines and labels for DCA Entry (green for long, red for short), Final SL (red), and TP (cyan), with debug labels for entries and averages.
4. Timeframe Flexibility: Automatically adjusts threshold periods and volatility factors based on the chart timeframe (1m, 5m, 15m, 1h, 4h), optimizing for scalping or swing trading.
5. Customizable Parameters: Allows fine-tuning of period, DCA factors, and visibility options.
Settings
Base Length (default: 10): Base period for pivot calculations, scaled by timeframe (e.g., 10 becomes 20 on 5m).
Type: 'Wicks' (high/low) or 'Body' (open/close) for price-based levels.
RR Ratio (default: 1.2): Risk-to-reward ratio for TP calculation.
DCA Entry Factor (default: 1.0): Multiplier for volatility-adjusted DCA entry distance.
Avg Level Factor (default: 2.0): Multiplier for averaging level distance.
Final SL Factor (default: 3.0): Multiplier for final stop-loss distance.
SL Type: 'Close' or 'High/Low' for stop-loss evaluation.
Show DCA Entry, Show Avg Level, Show Final SL: Toggle visibility of respective lines.
Show Win/Loss Table: Enable/disable performance tracking.
Line Style: Select 'Solid', 'Dashed', or 'Dotted'.
Usage Instructions
1. Application:
Add the "BUY & SELL Dynamic DCA Strategy - JOAT" via the Pine Editor or community scripts on TradingView.
2. Configuration:
Scalping (1m, 5m): Set Base Length to 5-10, use a low DCA Entry Factor (0.5-1.0) for tight entries, and a Final SL Factor of 2.0-3.0.
Swing Trading (15m, 1h, 4h): Increase Base Length to 15-20, use a higher DCA Entry Factor (1.0-2.0), and set Final SL Factor to 3.0-4.0 for wider stops.
Enable visual elements and adjust Line Style as preferred.
3. Signal Interpretation:
Long Trade: A green dashed "DCA Entry" line below the price triggers a "Long Entry" label on crossover down.
Short Trade: A red dashed "DCA Entry" line above the price triggers a "Short Entry" label on crossover up.
Averaging: A yellow "Avg" label (long) or magenta "Avg" label (short) appears at the respective averaging level.
Exits: TP (cyan) for wins, Final SL (red) for losses, tracked in the win/loss table.
Trade Management:
Scalping: Use 1m/5m for quick trades, averaging as price moves against you.
Swing Trading: Use 15m/1h/4h to capture trends, averaging for cost adjustment.
Manually adjust position size for averaging based on risk tolerance.
5. Performance Monitoring:
The top-right table updates with wins (green/red) and losses (red/green) per trade type, helping assess strategy effectiveness.
Limitations
Manual Averaging: Requires manual position size adjustment at the Averaging Level; automation is not included.
Timeframe Sensitivity: May require parameter tuning for optimal performance across 1m to 4h.
No Trend Filter: Sideways markets may generate noise; adding a trend indicator could enhance accuracy (future development).
Initialization Delay: First trade may be delayed until a pivot is detected, using the current price as a fallback.
Originality Justification
The custom volAdj method, which caps ATR at a percentage of price and scales it by timeframe, offering a unique volatility adjustment not found in standard indicators.
The dual-direction DCA with averaging, combining long and short strategies with volatility-modulated levels, providing a comprehensive trading framework.
The timeframe-adaptive design, automatically adjusting pivot periods and volatility factors, making it a versatile tool across scalping and swing trading.

Majors Rotation [AlphaAlgos]Majors Rotation System
---
Overview
The Majors Rotation System is a trend-following strategy designed to dynamically allocate capital to the strongest-performing assets in the market. By leveraging long-term, medium-term, and equity curve trend filters, this system identifies the top assets and rotates between them based on prevailing market conditions. The system is defaulted for Bitcoin (BTC), Ethereum (ETH), and Solana (SOL) but is fully customizable and can be applied to any asset, trading pair, or asset class across various timeframes.
How It Works
At the core of this strategy are three key trend filters that help determine which assets to allocate capital to:
1. Long-Term Trend Filter:
- The long-term trend filter evaluates the broader market's direction. If the market is in a bullish phase, the system will engage with top assets, while in a bearish phase, it will exit positions to avoid unnecessary risk exposure.
2. Medium-Term Trend Filter:
- This filter assesses the market's momentum over a medium-term period. It ensures that the strategy stays aligned with short-to-medium-term market moves. When positive momentum is detected, the system adjusts its positions accordingly to capture these trends.
3. Equity Curve Trend Filter:
- The system continuously tracks the performance of its portfolio. If the equity curve (the overall portfolio value over time) is trending downward, the system will exit positions to mitigate losses. If the equity curve is trending upward, the system remains active and continues to rotate between top assets based on market strength.
These three filters work together to ensure that the system remains in assets only when market conditions are favorable, avoiding unnecessary risk during downturns while capitalizing on profitable trends.
Flexibility
While the Majors Rotation System is initially set up with BTC, ETH, and SOL, it is fully adaptable. Traders can apply the system to any assets they prefer, whether they’re trading cryptocurrencies, stocks, commodities, or forex. The system is defaulted for the one day timeframe, although, it is designed to be used on any timeframe, making it suitable for both short-term and long-term strategies. This versatility allows users to tailor the system to their specific trading style and asset preferences.
System Features
- Asset Selection and Rotation: The system ranks multiple assets based on the trend filters, allocating capital to the top performers and rotating out of weaker ones.
- Risk Management: Dynamic risk management is integrated, allowing the system to exit positions during unfavorable market conditions, ensuring that capital is only exposed to assets showing strength.
- Performance Metrics: Key metrics such as the Sharpe Ratio, Sortino Ratio, Omega Ratio, and Drawdowns are tracked to provide insight into the system’s performance and risk-adjusted returns.
- Equity Curve Tracking: The system displays the equity curve, allowing users to visualize how the strategy is performing over time and compare it to a simple buy-and-hold strategy.
- Customization: Traders can modify the system’s asset selection to match their trading preferences.
Performance Metrics and Comparison to Buy-and-Hold Bitcoin
The Majors Rotation System tracks several important performance metrics to help traders evaluate its effectiveness:
1. Sharpe Ratio:
- The Sharpe Ratio evaluates the risk-adjusted return, measuring how much excess return the system generates relative to its volatility. A higher Sharpe Ratio indicates that the system is delivering better returns for each unit of risk.
2. Sortino Ratio:
- Similar to the Sharpe Ratio, the Sortino Ratio focuses on downside risk (negative volatility), providing a more accurate measure of how the system generates returns while avoiding significant drawdowns.
3. Omega Ratio:
- The Omega Ratio evaluates both the upside and downside of the system’s performance. It measures the probability of achieving returns higher than a specified threshold, offering a clearer picture of how the strategy manages both risk and reward.
4. Equity Drawdown:
- This metric tracks the peak-to-trough decline in the portfolio’s value. It helps traders understand the worst-case scenario in terms of losses. Lower drawdowns indicate better risk management and smoother performance.
These metrics give traders a clear understanding of the risk-adjusted returns and overall stability of the system. By tracking these figures, traders can assess whether the Majors Rotation System aligns with their investment goals and risk tolerance.
Disclaimer
This script is a technical analysis tool designed to assist with asset rotation and portfolio management. While it uses real-time market data and trend-following strategies to generate asset recommendations, there are no guarantees regarding future performance. The system relies on historical and real-time data, which may not accurately predict future market behavior. Trading and investing inherently involve risk, and past performance is not indicative of future results.
Users should always conduct their own research, use proper risk management strategies, and consult with a qualified financial advisor before making investment decisions. This script is not intended as financial advice and should only be used as part of a broader investment strategy.
